

Introduction
Assessments of severity of early and late leaf spots caused by Passalora arachidicola (Hori) U. Braun [syn. Cercospora arachidicola (S. Hori)], and Nothopassalora personata (Berk. & M.A. Curtis) U. Braun, C. Nakash., Videira & Crous [syn. Cercosporidium personatum (Berk. & M. A. Curtis) Deighton], respectively, of peanut (Arachis hypogaea L.), are important for evaluation of various treatments in research plots. Disease ratings are are also used to make decisions related to digging time if epidemics are severe, and estimating losses caused by the diseases.
Visual estimates of percent defoliation or use of the Florida 1-10 severity scale (Chiteka et al. 1988) are effective means of assessing severity of either disease. However, both are subjective, and estimates can vary among evaluators. Measurements of canopy reflectance at 800 nm wavelength measured with multispectral radiometer (CROPSCAN, Inc. Fargo, ND) have been used to assess leaf spot severity (Aquino et al. 1992, Nutter and Littrell 1996). More recently, Navia-Gine (Navia Gine 2012) found that a normalized difference vegetation index (NDVI) measured with a Crop Circle (Model ACS-210, Holland Scientific, Lincoln, NE) reflectance meter which emits at 590 nm and 880 nm (red/NIR) with photodetection of 400-680nm for detector 1 and 800-1100 nm for detector 2 correlated more closely with percent defoliation by leaf spot in Georgia-06G than reflectance in the near-infrared range measured with the same device. Jordan et al. (2017) reported similar separations of genotypes with NDVI measurements as with final visual leaf spot severity ratings using the same Crop Circle reflectance meter when disease epidemics were severe.
There are several commercially available reflectance meters that allow measurement of NDVI. In addition to the Crop Circle instrument, the GreenSeeker Handheld (Trimble, Westminster, CO) reflectance meter is commonly used for NDVI measurement in several crops. However, how NDVI measurements obtained with this instrument relate to levels of defoliation of peanut caused by leaf spot diseases has not been reported.
Recently, there have been reports comparing sensors for NDVI and other indices for assessing nutritional status (Amaral et al. 2015, Crain et al. 2012, Junior et al. 2016, Sharma et al. 2017, Shaver et al. 2010, 2011), biomass estimates (Amaral et al. 2015, Junior et al. 2016), and yield potential (Cao et al. 2015, Cao et al. 2016) in various crops. However, there have been few reports of comparisons of the different types of meters for disease assessment (Calcante et al. 2012), and no reports on how different meters compare for evaluation of leaf spot diseases of peanut. The objectives of this study were to determine the relationships among NDVI measurements obtained with the Crop Circle ACS-210 and the GreenSeeker Handheld Crop Sensor HCS-100 and visual assessments of severity of leaf spot diseases of peanut.
Materials and Methods
Field design and plot establishment
Field experiments conducted in 2015 at the University of Georgia, Coastal Plain Experimental Station (UGA-CPES) were utilized for the leaf spot assessment comparisons. There were four trials altogether. One trial was conducted at the UGA-CPES Gibbs Farm, one trial at the UGA-CPES Rigdon Farm, and two trials at the UGA-CPES Lang Farm. All fields had a history of severe epidemics of early and late leaf spot. However, in recent years, late leaf spot was more prevalent. Trials utilized natural inoculum of the leaf spot pathogen in the field.
A randomized complete block design was used in all trials. All plots were irrigated as needed to maintain favorable conditions for leaf spot epidemics and for peanut growth
Trial 1
A field trial was conducted at the University of Georgia Gibbs Farm. The trial included a total of ten treatments consisting of nine advanced breeding lines (Jordan et al. 2017) and cultivar Georgia-12Y (Branch 2013). There were three replications. Planting date was 10 April 2015. Plots were 6 m long by 1.8 m wide.
Trial 2
A field trial with a total of eight treatments was conducted at the University of Georgia Rigdon Farm. Treatments consisted of two cultivars, Georgia-06G (Branch 2007) and Georgia-12Y, factorially arranged with two cultivation treatments, non-cultivated, and cultivated with a tine weeder, and two seed bed configurations, flat seed bed and planting in a furrow (Jordan 2017). There were three replications. Planting date was 6 May 2015. Plots were 9.2 m long by 1.8 m wide.
Trial 3
A planting date experiment conducted at the University of Georgia Lang Farm was utilized. 24 treatments consisted of two cultivars, Georgia-06G and Georgia-12Y in factorial arrangement with treated and nontreated seed, and six planting dates, April 24, April 27, May 4, May 11, May 19, and May 26. Seed treatment consisted of azoxystrobin 0.128 g/kg of seed, fludioxanil 0.008 g/kg of seed, and mefenoxam 0.0016 g/kg of seed applied as Dynasty PD (2.5 g/kg of seed) (Syngenta Crop Protection, Greensboro, NC). Plots were 9.2 m long by 1.8 m wide. There were four replications.
Trial 4
A field experiment was conducted in which 13 treatments consisted of nine advanced breeding lines, planted without seed treatment, and cultivars Georgia-06G and Georgia-12Y. Each of Georgia-06G and Georgia-12Y were planted with and without seed treatment (Jordan et al. 2017). Seed treatment was same as that described previously. Planting date was May 20. Plots were 9.2 m long by 1.8 m wide. There were three replications. In all trials, seeding density was 14.8 seed/m of row.
Disease assessment
Leaf spot severity was assessed for each plot using three different methods.
For each evaluation date, leaf spot severity was assessed visually using the Florida 1-10 leaf spot severity scale where 1 = no disease, 0% defoliation, and 10 = 100% defoliation, plants dead, killed by leaf spot (Chiteka et al., 1988). The assessment included parting the branches of the upper canopy to allow estimation of severity in the lower canopy. Percent defoliation was calculated from Florida 1-10 severity ratings using the formula developed by Li et al (2012):
On each evaluation date, canopy reflectance was measured using active sensor reflectance meter (Crop Circle model ACS-210, Holland Scientific, Lincoln, NE) and a GreenSeeker Handheld (Trimble, Westminster, CO). The Crop Circle meter was the same device used by Navia Gine (2012). Both sensors simultaneously measure canopy reflectance in the visible and near infrared portions of the light spectrum. The Crop Circle sensor measures visible portions (VIS) centered at 590 nm wavelength and near infrared (NIR) centered at 880 nm wavelength. The GreenSeeker sensor measures VIS and NIR centered around 660 nm and 780 nm wavelengths, respectively. For each plot, a vegetation index, presented as the normalized difference vegetation index (NDVI), was calculated using the formula:

For each evaluation within each trial, visual leaf spot ratings and reflectance measurements were made on the same day in rapid succession. All ratings and reflectance measurements were done by the same evaluator. Visual leaf spot assessments and sensor readings were made at Gibbs Farm on 140 and 145 DAP, at the Rigdon Farm trial on 119 DAP.
Leaf spot ratings were made at 133 and 140 DAP for each planting date in the Lang Farm planting date trial and 105, 112, 119, 126, 133, and 140 DAP in the Lang Farm genotype trial.
For each evaluation, the respective sensor was carried manually and positioned directly over the center of the row in the nadir view at a distance of approximately 1.0 m above the plant canopy. Scans are made of the entire length of both rows of each plot by walking at a speed of approximately 0.9 m/sec without interruption. Both devices emit their own light. The Crop Circle instrument generates visible amber light (590 nm) and near infrared light (880 nm). For the Crop Circle instrument, sensor readings were recorded 10 times per second. The final output of the sensor was a pseudo-reflectance value, an invertible linear transformation, for both NIR and VIS bands and the calculated NDVI. The mean of sensor readings for NDVI was calculated for each plot, which was used for analysis. The GreenSeeker emits bursts of visible red (660 nm) and near infrared light (770 nm) and measures the amount of light that reflects back at the sensor. The unit continues to sample the scanned area as long as the trigger remains engaged. The unit automatically averages the NDVI rating, and the average is displayed as soon as the trigger is released. The NDVI reading was recorded manually for each plot.
Regression analysis was used to examine the linear and nonlinear relationships between NDVI and final percent defoliation for each location. Proc GLM (SAS v 9.4) was used to examine linear and quadratic relationships among percent defoliation and NDVI measured by the two reflectance meters. Regression was used to examine the relationships within individual factors such as cultivar, treatment, and evaluation date. When responses were similar for various factors, regression was conducted using data pooled across the factors or evaluation times. If a significant (P ≤ 0.05) quadratic response was observed that improved fit of the data compared to a linear model based on R2 values and plots of residuals, the quadratic model is presented. Otherwise, a linear model is presented if a significant (P ≤ 0.05) linear response was observed.
Results
Late leaf spot predominated in all studies. Very little early leaf spot was observed.
Trial 1
Across sample dates, visual estimates of percent defoliation ranged from 0 to 48%. NDVI measured with the GreenSeeker (NDVIGS) instrument decreased linearly with increasing percent defoliation (Figure 1A). There was no significant regression for the relationship between NDVI measured with the Crop Circle instrument (NDVICC) and percent defoliation (P > 0.36) (Figure 1A) or the relationship between NDVI measured between the two instruments (P > 0.58) (Figure 1B).
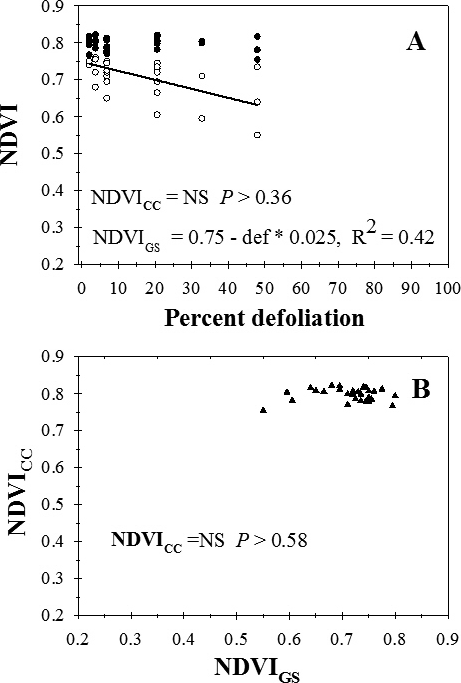
Relationship between percent defoliation (def) by late leaf spot and normalized difference vegetation index (NDVI) measured with a Trimble GreenSeeker (NDVIGS) and a Crop Circle Model ACS-210 (NDVICC) reflectance meters (A), and (B) the relationship between NDVIGS and NDVICC, University of Georgia, Gibbs Farm, Tifton, GA, 2015.
Trial 2
Visual estimates of percent defoliation ranged from 3.8% to 76.5%. Across cultivars and treatments, there was no significant regression (P > 0.57) for NDVIGS on percent defoliation (Figure 2A). NDVICC decreased linearly of with increasing percent defoliation, but data were highly variable (Figure 2A). There was no significant regression (P > 0.69) for the relationship between NDVICC and NDVIGS (Figure 2B).
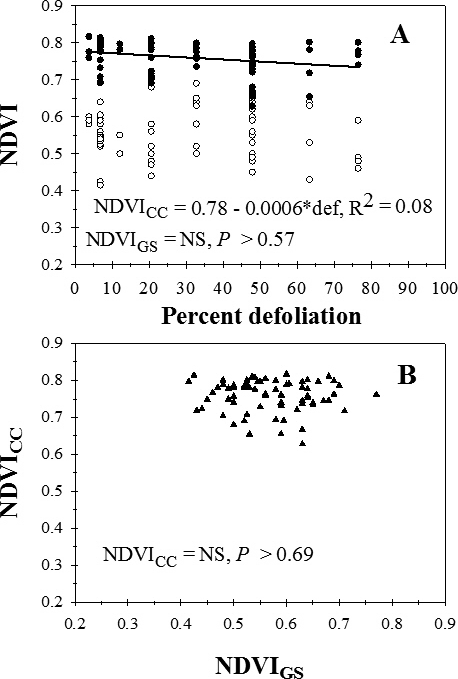
Relationship between percent defoliation (def) by late leaf spot and normalized difference vegetation index (NDVI) measured with a Trimble GreenSeeker (NDVIGS) and a Crop Circle Model ACS-210 (NDVICC) reflectance meters (A), and (B) the relationship between NDVIGS and NDVICC, University of Georgia, Rigdon Farm, Tifton, GA, 2015.
Trial 3
Visual estimates of percent defoliation ranged from 0 to 100%. Across planting dates and evaluation dates, NDVIGS decreased linearly with increasing visual estimates of defoliation on Georgia-06G (Figure 3A) and decreased according to a quadratic function of percent defoliation on Georgia-12Y (Figure 3B). NDVICC decreased linearly with increasing percent defolation on both Georgia-06G (Figure 3A) and Georgia-12Y (Figure 3B). Across all factors, NDVICC increased with increasing NDVIGS according to a quadratic function (Figure 3C).
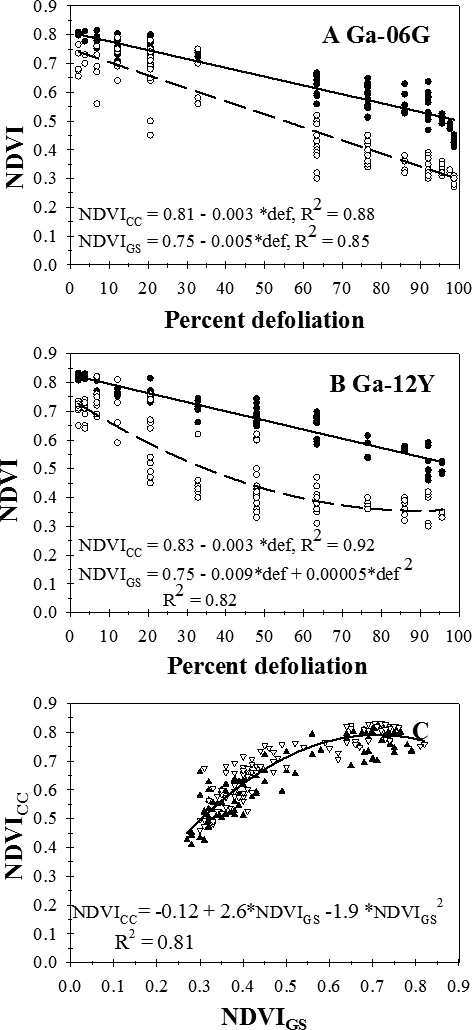
Relationship between percent defoliation by late leaf spot and normalized difference vegetation index (NDVI) measured with a Trimble GreenSeeker (NDVIGS) (Open circles, dashed lines) and a Crop Circle Model ACS-210 (NDVICC) (Closed circles, solid lines) reflectance meters for cultivars Georgia-06G (A) and Georgia-12Y (B) and (C) the relationship between NDVIGS and NDVICC, pooled across Georgia-06G (Closed triangles) and Georgia-12Y (Open triangles), University of Georgia, Lang Farm, Tifton, GA, 2015.
Trial 4
Percent defoliation ranged from 0 to 100%. Across all cultivars, treatments, and evaluation dates, NDVIGS decreased with increasing defoliation according to two linear segments in a piecewise regression with rate of decline decreasing above 47.9 % defoliation (Figure 4A). NDVICC decreased with increasing defoliation as described by a two linear sector piecewise regression with a break point at approximately 91.7% defoliation (Figure 4B). NDVICC declined more rapidly after that point as defoliation increased. NDVICC increased according to a quadratic function of NDVIGS measured with the GreenSeeker instrument (Figure 4C).
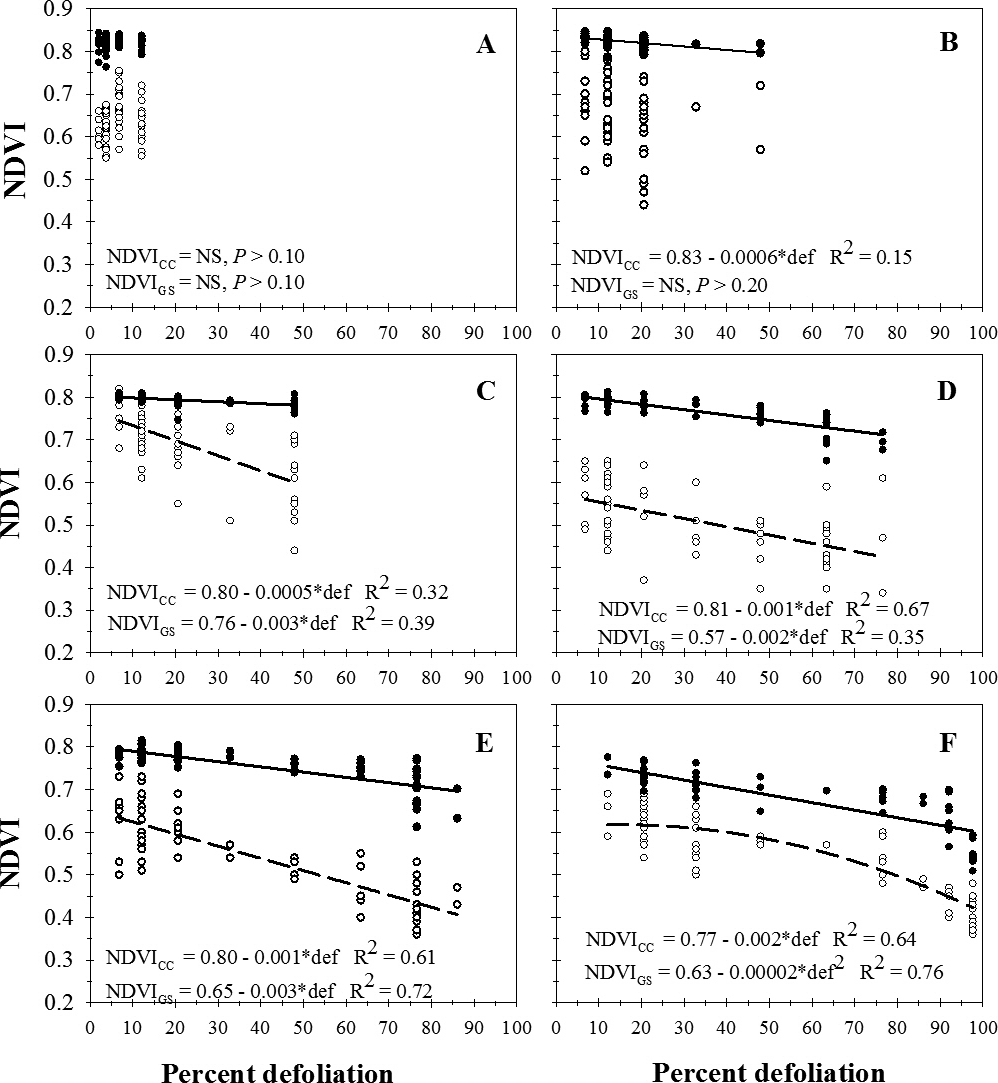
Relationship between percent defoliation (def) by late leaf spot and normalized difference vegetation index (NDVI) measured with a Trimble GreenSeeker (NDVIGS) (Open circles, dashed lines) and a Crop Circle Model ACS-210 (NDVICC) (Closed circles solid lines) reflectance meters 105 (A), 112 (B), 119 (C), 126 (D), 133 (E), and 140 (F) days after plantingUniversity of Georgia, Lang Farm, Tifton, GA, 2015.
Discussion
Both Crop Circle and GreenSeeker sensors show potential for estimating relative levels of defoliation caused by leaf spot. However, relative to visual estimates of defoliation, NDVI measurements from neither sensor consistently estimated defoliation, and neither sensor showed much potential for measuring leaf spot severity when defoliation was low. Both devices had better correlation with visual defoliation estimates when the range of defoliation levels included values greater than 50%. Based on regressions in two studies which included high levels of defoliation, the Crop Circle typically had a better fit than the GreenSeeker when compared to visual ratings as verified by R2 values. In the Lang vigor trial, the variation was much greater before defoliation occurred in the leaf spot epidemic. Based on models describing the relationship between NDVICC and defoliation and NDVIGS and defoliation, the level of defoliation represented by a given NDVI level was not consistent across trials. Variables such as gaps in foliar canopy and weeds may explain the inconsistency.
The canopy reflectance in the visible and near infrared regions is influenced by the amount of green tissue present. In the case of peanut leaf spot, defoliation appears to be the greatest reason for a decrease in NDVI values, although other factors can contribute to the reduction in NDVI such as stem rot and tomato spotted wilt. There was little consistent change in NDVI measured by either instrument at low levels of defoliation. Leaf spot epidemics and subsequent defoliation usually progress from lower canopy upward (Plaut and Berger 1980). Visual assessments of leaf spot severity typically include physically parting the branches of the upper canopy to view leaves in the lower canopy. Since reflectance measurements are made from above the peanut canopy, the level of defoliation detectable with reflectance measurements will likely be affected by how much healthy tissue remains higher in the canopy.
Since the Crop Circle and the GreenSeeker use different VIS and NIR wavelengths it is not surprising that the NDVI values were not equal. NDVIGS values typically were lower than NDVICC for the same evaluation. They were also typically more variable, relative to visual estimates of percent defoliation. These trends may relate to the portion of the light spectrum being projected or measured by the two instruments. Explanation for differences in relationships of the two NDVI measurements with defoliation, and the nonlinear relationship between NDVICC and NDVIGS are speculative. Regardless of the reason, based on relationships between these measurements with percent defoliation as well as with each other in these trials, NDVI values for the two devices should not be assumed to be interchangeable.
In this study, neither device correlated well with visual estimates in Trial 1. In this trial, however, there was some indication, that NDVIGS was a better predictor of low levels of defoliation than NDVICC. Factors other than leaf spot may have contributed to variability in NDVI in those cases. In that trial, a brief epidemic of Choanephora leaf spot, caused by Choanephora spp., was observed. The epidemic resulted in dead foliage that remained in the upper canopy throughout the growing season. In Trial 2, sparse stand was a problem throughout the season. Although defoliation was higher than that at the Gibbs Farm, bare ground between plants may have been responsible for considerable variation in the reflectance measurements.
Although both sensors gave NDVI ratings that were correlated with visual ratings when the upper range of defoliation was high, the Crop Circle typically had less variation than the GreenSeeker. The GreenSeeker is less expensive than the Crop Circle, and made it easier to acquire the NDVI data from an individual plot than the Crop Circle. The GreenSeeker automatically calculated a mean value of NDVI for a plot, whereas, for the Crop Circle, means must be computed from downloaded data. However, the Crop Circle data allows examination of variability of reflectance within a plot, and data provided includes the VIS and NIR reflectance components from which the NDVI is calculated. The Crop Circle device can be linked with global positioning system equipment and allows mapping.
Two active canopy sensors were compared to visual leaf spot ratings using defoliation estimates derived from Florida Scale (Chiteka et al, 1988) ratings in 2015 in four trials. To the best of our knowledge, this is the first report of comparison of GreenSeeker and Crop Circle reflectance meters for evaluating leaf spot in peanut although this comparison has been used in many other crop systems. Both devices provided NDVI estimates that correlate with visual assessments of peanut leaf spot severity, but only when there is an adequate range of defoliation. Both devices show potential for use for leaf spot assessment. However, the same NDVI measurement did not represent the same level of defoliation in all trials for either instrument, and NDVI values obtained from the two meters are not interchangeable. Results from this study indicate that neither the GreenSeeker nor the Crop Circle reflectance meter should be used as a sole means of evaluating leaf spot severity.
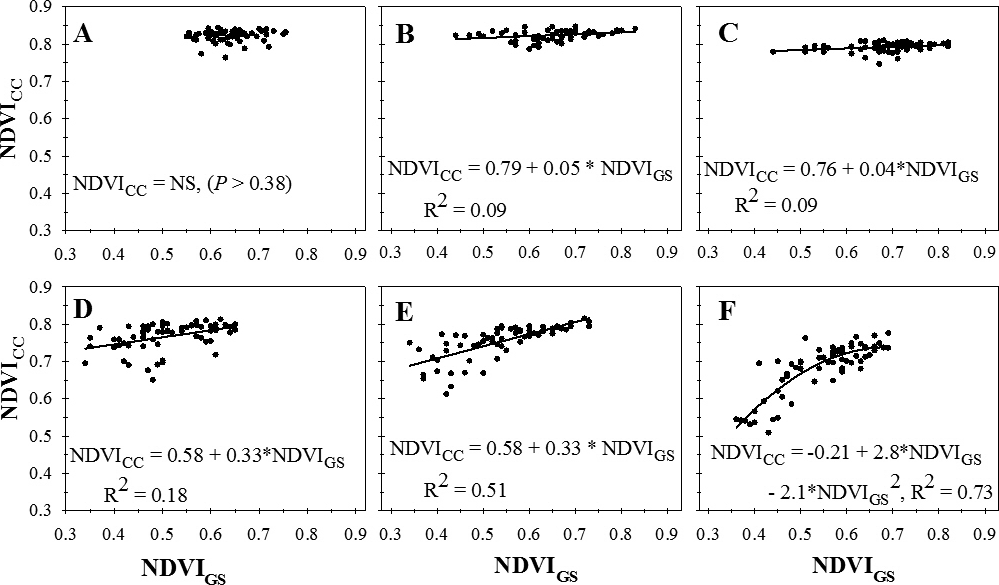
Relationship between normalized difference vegetation index (NDVI) measured with Trimble GreenSeeker (NDVIGS) and Crop Circle Model ACS-210 (NDVICC) reflectance meters 105 (A), 112 (B), 119 (C), 126 (D), 133 (E), and 140 (F) days after planting, University of Georgia, Lang Farm, Tifton, GA, 2015.
Acknowledgements
Support for this research was funded in part by the National Peanut Board, the Georgia Agricultural Commodity Commission for Peanuts, and Georgia Foundation Seed. We also acknowledge the United States Department of Agriculture-National Institute of Food and Agriculture, Hatch Project GEO00858. The authors thank Mike Heath, Ron Hooks, Matthew Wiggins, Kyle Parris, Neal Roberson, Harvey Kendrick, and Dr. Dana Sullivan for their help in this project.
Literature Cited
L. R., Amaral, J. P., Molin, G., Portz, F. B., Finazzi, and L Cortinove, (2015). Comparison of crop canopy reflectance sensors used to identify sugarcane biomass and nitrogen status. Precis. Agric. 16: 15- 28.
V. M., Aquino, F. M., Shokes, R. D., Berger, D. W., Gorbet, and T. A Kucharek, (1992). Relationships among late leafspot, healthy leaf area duration, canopy reflectance, and pod yield of peanut. Phytopathology 82: 546- 552.
W. D Branch, (2007). Registration of 'Georgia-06G' peanut. J. Plant Reg 1: 120.
W. D Branch, (2013). Registration of 'Georgia-12Y' peanut. J. Plant Reg 7: 1- 3.
A., Calcante, A., Mena, and F Mazzetto, (2012). Evaluation of "ground sensing" optical sensors for diagnosis of Plasmopara viticola on vines. Spanish Journal of Agricultural Research 10: 619- 630.
Q., Cao, Y., Miao, G., Feng, X., Gao, F., Li, B., Liu, S., Yue, S., Cheng, S. L., Ustin, and R Khosla, (2015). Active canopy sensing of winter wheat nitrogen status: An evaluation of two sensor systems. Comput. Electron. Agr 112: 54- 67.
Q., Cao, Y., Miao, J., Shen, W., Yu, F., Yuan, S., Cheng, S., Huang, H., Wang, W., Yang, and F Liu, (2016). Improving in-season estimation of rice yield potential and responsiveness to topdressing nitrogen application with Crop Circle active crop canopy sensor. Precis. Agric. 17: 136- 154.
Z. A., Chiteka, D. W., Gorbet, F. M., Shokes, T. A., Kucharek, and D. A Knauft, (1988). Components of resistance to late leafspot in peanut. I. Levels and variability-implications for selection. Peanut Sci 15: 25- 30.
Crain, J., Ortiz-Monasterio, I., and Raun, B 2012 Evaluation of a reduced cost active NDVI sensor for crop nutrient management. J. Sensors: doi:10.1155/2012/582028.
B. S Jordan, (2017). Integrated Disease Management in Peanut with Emphasis on Organic Production. The University of Georgia, M.S, thesis..
B. S., Jordan, A. K., Culbreath, T. B., Brenneman, R. C., Kemerait, and W. D Branch, (2017). Late leaf spot severity and yield of new peanut breeding lines and cultivars grown without fungicides. Plant Dis 101: 1843- 1850.
C. K., Junior, A. M., Guimaraes, and E. F Caires, (2016). Use of active canopy sensors to discriminate wheat response to nitrogen fertilization under no-tillage. Eng. Agric 36: 886- 894.
Y., Li, C. Y., Chen, S. J., Knapp, A. K., Culbreath, C. C., Holbrook, and B Guo, (2012). Variability in field response of peanut genotypes from the U.S. and China to Tomato spotted wilt virus and leaf spots. Peanut Sci 39: 30- 37.
F. W., Nutter, and R. H Littrell, (1996). Relationships between defoliation, canopy reflectance and pod yield in the peanut-late leafspot pathosystem. Crop Prot 15: 135- 142.
J. L., Plaut, and R. D Berger, (1980). Development of Cercosporidium personatum in three peanut canopy layers. Peanut Sci 7: 46- 49.
Sharma, L. K., Sukhwinder, K. B., Dwyer, J. D., Plant, A. B., and Bhowmik, A 2017 A case study of improving yield prediction and sulfur deficiency detection using optical sensors and relationship of historical potato yield with weather data in Maine. Sensors 17:doi:10.3390/s17051095.
T. M., Shaver, R., Khosla, and D. G Westfall, (2010). Evaluation of two ground-based active crop canopy sensors in maize: Growth stage, row spacing, and sensor movement speed. Soil Sci. Soc. Am. J. 74: 2101- 2108.
T. M., Shaver, R., Khosla, and D. G Westfall, (2011). Evaluation of two crop canopy sensors for nitrogen variability determination in irrigated maize. Precis. Agric. 12: 892- 904.
Notes
- First, and fifth authors: Graduate Student, and Professor, Dept. of Plant Pathology, The University of Georgia, Tifton, GA 31793; Second author: Professor, Dept. of Crop and Soil Sciences, The University of Georgia, Tifton, GA 31793. Third and fourth authors, Research Ecologist, and Physical Science Technician, USDA-ARS, Southeast Watershed Research Unit, Tifton, GA 31793. [^] *Corresponding author's E-mail: spotwilt@uga.edu