

Introduction
Peanut (Arachis hypogaea L.) is grown worldwide as an oil, cash, food, and feed crop, and is a key source for protein, calories, vitamins, and minerals (Suchoszek-Lukaniuk et al., 2011; Guimón and Guimón, 2012). About 46 million tons of peanut are produced globally each year, but average peanut yields in developing countries are only a fraction of the average yield achieved in the United States (FAOSTAT, 2018). Developing high yielding peanut cultivars with strong resistance/tolerance to biotic and abiotic stress, strong peg strength, and plant vigor is critical to improve peanut productivity (Bantilan et al., 2003; Holbrook et al., 2015). However, the narrow genetic base of cultivated peanut limits crop improvement (Bertioli et al., 2016; Stalker et al., 2016). Yet, there are more than 80 wild peanut relatives and those analyzed to date have much higher levels of genetic polymorphism than cultivated peanut. Introgression of wild segments into cultivated peanut has been found to not only improve disease resistance but also to strengthen a number of agronomic traits such as flowering precocity, seed and pod number or length and size, and pod maturity (Fonceka et al., 2012; Moretzsohn et al., 2013; Stalker et al., 2016). However, wild Arachis species also have undesirable traits such as small seed size, a trailing growth habit, and weak peg strength that have to be selected against when used in peanut breeding programs (Fonceka et al., 2012; Stalker et al., 2013; Stalker, 2017).
Peanut is a unique crop that flowers above ground but whose fruit develop underground. In the process of pod formation, the peg, a needle-like structure, extends geotropically from the base of a fertilized flower after fertilization. Ovules are located at the tip of the peg and after penetrating the soil the peg tip and ovules swell to develop into a pod and seed, respectively. Most harvesting of peanut in the United States is mechanized. At the time of seed maturity, the peanut plant is inverted from the soil by an inverter while retaining the peg and pods that are attached to the plant. A peanut combine then collects the pods, but if the peg is broken in the process of inverting, the pod is lost in the field. Therefore, peg strength is an important agronomic trait for peanut and variability of peg strength in cultivated peanut results in differential levels of yield loss (Sorensen et al., 2015; Sorensen et al., 2017). Peg strength is affected by genotype, fungal and viral infection, maturity, peg age, and field conditions (Bauman and Norden, 1971; Troeger et al., 1976; Thomas et al., 1983; Chapin and Thomas, 2005; Sorensen et al., 2015; Sorensen et al., 2017). Significant differences in peg strength among peanut cultivars can be detected, and there is enough phenotypic variability to produce cultivars with improved peg strength (Thomas et al., 1983). Decreased peg strength was correlated with infection by southern stem rot (Sclerotium rolfsii) and increased peg strength was correlated with infection by Tomato spotted wilt virus (Thomas et al., 1976; Chapin and Thomas, 2005). The increased peg strength of plants infected with Tomato spotted wilt virus is irrelevant to yield due to the severe stunting caused by this virus and the consequent major yield losses (Srinivasan et al., 2017). Therefore, selecting for resistance alleles to both these diseases as well as for peg strength alleles will likely increase peanut yields.
Anatomical characteristics associated with peg strength have been studied in cultivated peanut. All pegs have vascular bundles and associated fiber bundle caps arranged in a ring surrounding stelar pith cells that gradually disintegrate with maturity, ultimately forming a hollow stele. Additionally, most pegs have epidermal hairs (Thomas et al., 1983). However, pegs of different genotypes have been found to vary in size and shape of their fiber bundle caps, degree of lignification in fiber bundle caps, number of cambial and parenchymatous cells between vascular bundles, number of xylem vessels per vascular bundle, and size of tannin cells (Thomas et al., 1983; Tiwari et al., 1988). Cultivated peanut genotypes with strong pegs have bigger, crescent-shaped fiber bundle caps, fewer rows of interfascicular cambium and parenchyma cells between vascular bundles, and more xylem vessels per vascular bundle as compared to genotypes with weak pegs (Thomas et al., 1983). Peg diameter and number of vascular bundles per peg are not related to peg strength (Thomas et al., 1983; Tiwari et al., 1988).
Weak peg strength of Arachis species has not been documented, but other undesirable traits such as small seed size, long peg length, low yield, and trailing branch habit have been recorded (Fonceka et al., 2012; Stalker, 2017). Some of these undesirable traits have been found in early generations of introgressed materials such as TxAG-6, which had strong nematode resistance but low yield and poor pod and seed quality but can be selected against using molecular markers (Church et al., 2000; Stalker, 2017). Therefore, as the first objective of this study, peg strength in several Arachis species was measured. Since direct crossing between wild diploid species and cultivated peanut (allotetraploid) would result in sterile triploid progeny, allotetraploids were made from diploid interspecific hybrids and chromosomes were doubled to bridge the crossing barrier. Allotetraploids have additional phenotypic variation due to novel interactions between the newly combined genomes, increased chromosome content leading to the gigas effect, and new allele dosages (Tal, 1980; Li et al., 1996; Ramsey and Schemske, 1998; Ni et al., 2009; Leal-Bertioli et al., 2017). Therefore, it is important to study peg strength in these allotetraploids. It is possible that ploidy level could affect peg strength since peg strength is correlated to bundle cap area and increased ploidy level was reported to be associated with larger plant tissues in Arachis (Leal-Bertioli et al., 2017). In this study, the peg strengths of seven Arachis species, four allotetraploids, six (peanut breeding line x allotetraploid) F1 hybrids, and two cultivated breeding lines were measured. To elucidate differences in peg strength among these materials, their peg anatomy was also documented.
Materials and Methods
Plant Materials.
Wild Arachis species, A. cardenasii Krapov. and W.C. Gregory (PI 262141, GKP 10017; abbrev.: Card), A. correntina (Burkart) Krapov. and W.C. Gregory (PI 262808, GKP 9530; abbrev.: Cor), A. duranensis Krapov. and W.C. Gregory (PI 468197, GKBSPSc 30060; abbrev.: Dur), A. ipaensis Krapov. and W.C. Gregory (PI 468322, GKBSPSc 300076; abbrev.: Ipa), A. stenosperma Krapov. and W.C. Gregory (PI 338280, 410; abbrev.: Sten410), A. stenosperma (PI 666100, V 10309; abbrev.: StenV10309), and A. valida Krapov. and W.C. Gregory (PI 468154, KG 30011; abbrev.: Val) were obtained from Dr. H.T. Stalker at North Carolina State University (NCSU). Two accessions of A. stenosperma were included because both have been used to produce allotetraploids in the UGA Tifton and Athens peanut breeding programs, and resistances to pests have been found to vary between accessions within Arachis species (Stalker and Campbell, 1983). IpaDur4x, IpaCor4x, IpaStenV103094x, and ValStenV103094x allotetraploids were created from the diploid hybrids by colchicine treatment at the University of Georgia (UGA) Tifton Campus (Table 1). Cultivated peanut controls included A. hypogaea ‘13-2113’ and A. hypogaea ‘13-1014,’ selected breeding lines from [(C1805-617-2 x ‘Florida-07’) x ‘Georgia-06G’] in which C1805-617-2 was a selection from ‘Tifguard’ x ‘Florida-07’. Line 13-2113 was selected with the ADSNP124 (A09 6720287) marker (Chu et al., 2016) to have an A09 A. cardenasii introgression that confers nematode resistance. Hybrids were made by crossing the allotetraploids to the cultivated peanut controls. These hybrids were confirmed using the Axiom_Arachis2 SNP array (ThermoFisher Scientific, Waltham, MA) (Clevenger et al., 2018; Korani et al., 2019). DNA was extracted from newly formed leaves of the germinated plants with the Qiagen DNeasy Plant mini kit (Qiagen, Germantown, MD), and SNP calling was performed with Axiom Analysis Suite (Version 1.2). Genetic markers were grouped into six categories by the software depending on the quality and separation of markers 1) Monomorphic, 2) PolyHighResolution, 3) NoMinorHom, 4) OfftargetVariant, 5) CallRateBelowThreshold, and 6) Other. The markers in the PolyHighResolution class were used for analysis since the grouping of samples was unambiguous and all of the samples passed quality control.
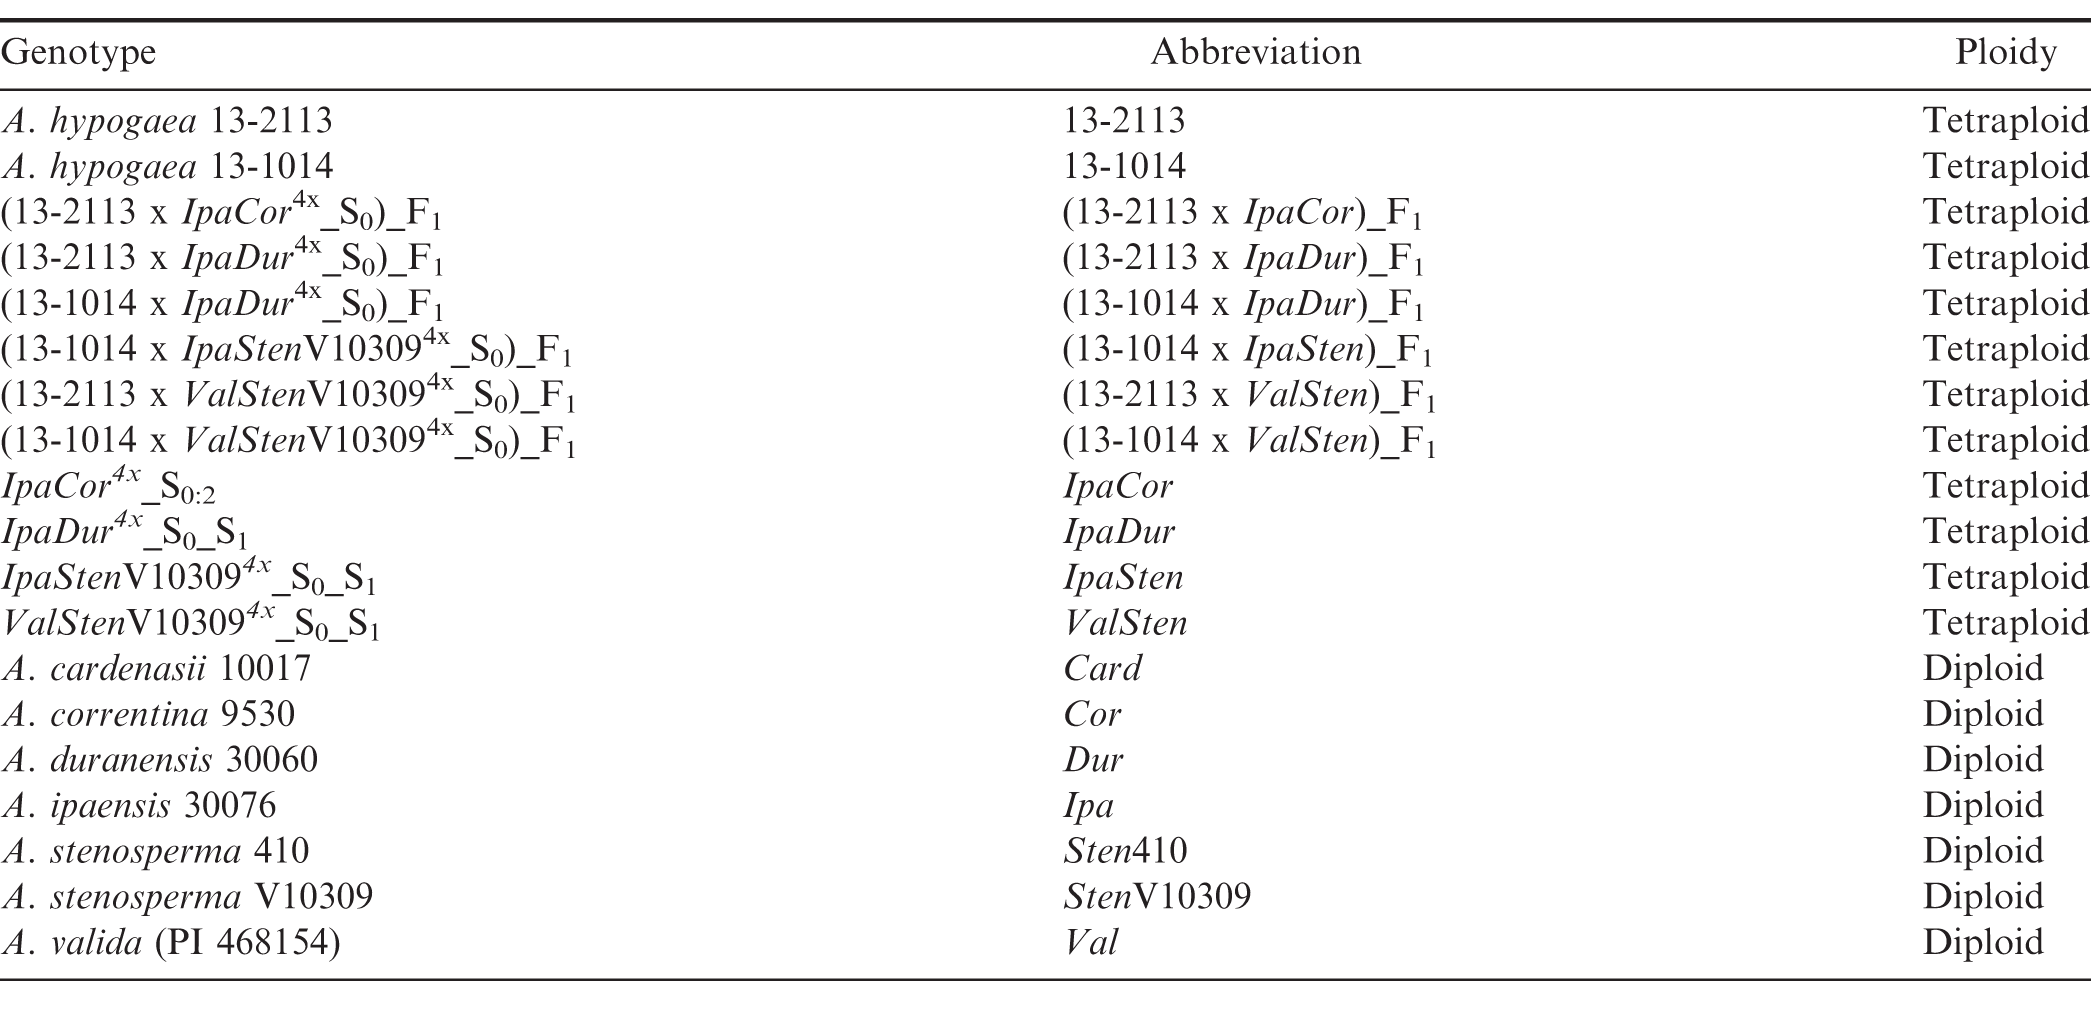
Genetic materials tested and their abbreviations and ploidy level.
In April, 2018, A. hypogaea x allotetraploid seeds and in May, 2018, diploid Arachis, allotetraploid, and cultivated control seeds were coated in Vitavax PC (Vitavax, Crompton, Middlebury, CT) and treated overnight in 0.5% Florel Growth Regulator solution (Lawn and Garden Products Inc., Fresno, CA) to break dormancy. Forty-eight hours later, seeds were planted in #123 7.62 cm round x 11.43 cm deep Jiffy pots (Harris Seeds, Rochester, NY) filled with Promix growth medium (Premier Tech Horticulture, Quakertown, PA). On 18 April, the (A. hypogaea x allotetraploid) plants were transplanted from the greenhouse to a 20 m by 4 m plot in the Gibbs Farm in Tifton, GA in a completely randomized design. On 14 May, the allotetraploids and cultivated peanut controls were transplanted from the greenhouse to a 10 m by 40 m plot in the UGA NESPAL field in Tifton, GA, in a randomized complete block design with seven replications. In the same field in an adjacent plot 50 m long and 8 m wide, each diploid Arachis species was planted as a block spaced approximately 3.7 m apart from neighboring species blocks, on 14 May. While planted in a test area adjacent to the allotetraploids and cultivated controls in a randomized complete block design, the diploid Arachis species were randomized separately. Standard field management was applied.
Peg Strength.
Upon harvest, five pegs from plants free of Tomato spotted wilt virus were evaluated for each genotype. To minimize the effect of uneven maturity on peg strength, pods at the orange stage of maturity were selected (Anco and Thomas, 2020). For cultivated peanut and hybrids from A. hypogaea x allotetraploid crosses, the saddle area of each pod was scraped with a single-edge razor blade to expose the mesocarp layer and pods with orange-colored mesocarp were selected. For the allotetraploids and wild diploid species, most of the double-pods had a long isthmus connecting the two pods. Therefore, the dorsal side of the pod connected directly to the peg was scraped to determine its maturity. Stems with selected pods were excised from each plant. Pods and pegs with any physical damage were excluded. The selected pod was detached carefully from the peg by using a digital force gauge (IMADA, model DS2-11, Northbrook, IL) that was modified with special grips to hold the pod. Detachment force of these pegs was measured at the break point of detachment. Peg ends attached to both the stem and the pods were excised and preserved in FAA fixative (10% formaldehyde, 50% ethanol, 5% acetic acid, and 35% distilled water) for 48 hrs then stored in 80% ethanol prior to anatomical characterization.
Anatomical characterization.
Of the five pegs per genotype, the three most intact pegs, as determined by clean excision sites and clean break point from the pods, were selected for anatomical characterization. Cross-sections were taken from both the proximal (the part of the peg connecting to the plant stem) and distal (the part of the peg connecting to the pod) positions for each peg and were then stored separately. Each cross-section was made by wedging the peg into a small incision in a block of Styrofoam to keep the peg secure and cutting freehand using a double-edged razor blade (Personna, Knoxville, TN). The cross sections were kept separately in 2 mL tubes (Phenix Research, Swedesboro, NJ) suspended in 80% ethanol until microscopic examination and imaging. Slides were prepared by first placing two coverslips approximately 5 mm apart on the slide and then transferring the cross-sections to the gap using a 2 mL disposable transfer pipette (ThermoFisher Scientific, Waltham, MA) so that the cross-sections were suspended in 80% ethanol between the two coverslips. A third coverslip was placed on top of the two coverslips with the suspended cross-section between them. Images were taken using a Zeiss AxioCam camera on a Zeiss Axioskop 2 plus microscope (Carl Zeiss Microscopy, Thornwood, NY, USA) with transmitted light and ultraviolet light at 5x and 10x magnification. Fifty μm scale bars were added to each photo using the Zeiss AxioVision Program.
Fiber bundle cap number and tannin cell number were counted directly from the microscope images. Tannin cell count was included even though it was not expected to correlate with peg strength. Tannin cells may play an important role in defense response (Beckman, 2000), and the documentation of variation may be considered in relevant future studies. Peg area, bundle cap area, and distance between bundle caps were measured from the images with Assess 2.0 (APS Press) (Fig. 1). However, the images were first analyzed with Materials Image Processing and Automated Reconstruction (MIPAR™) software (Sosa et al., 2014) to find the ratio of pixels to the 50 μm scale bar in the photos. The ratio was 41 px to 50 μm for 5x magnification images and 75 px to 50 μm for 10x magnified photos; all images were 1,296 px by 1,018 px. In Assess 2.0, 5x images were calibrated by imputing the dimensions 1.58 mm x 1.24 mm, while 10x images were calibrated by imputing 0.864 mm x 0.679 mm.
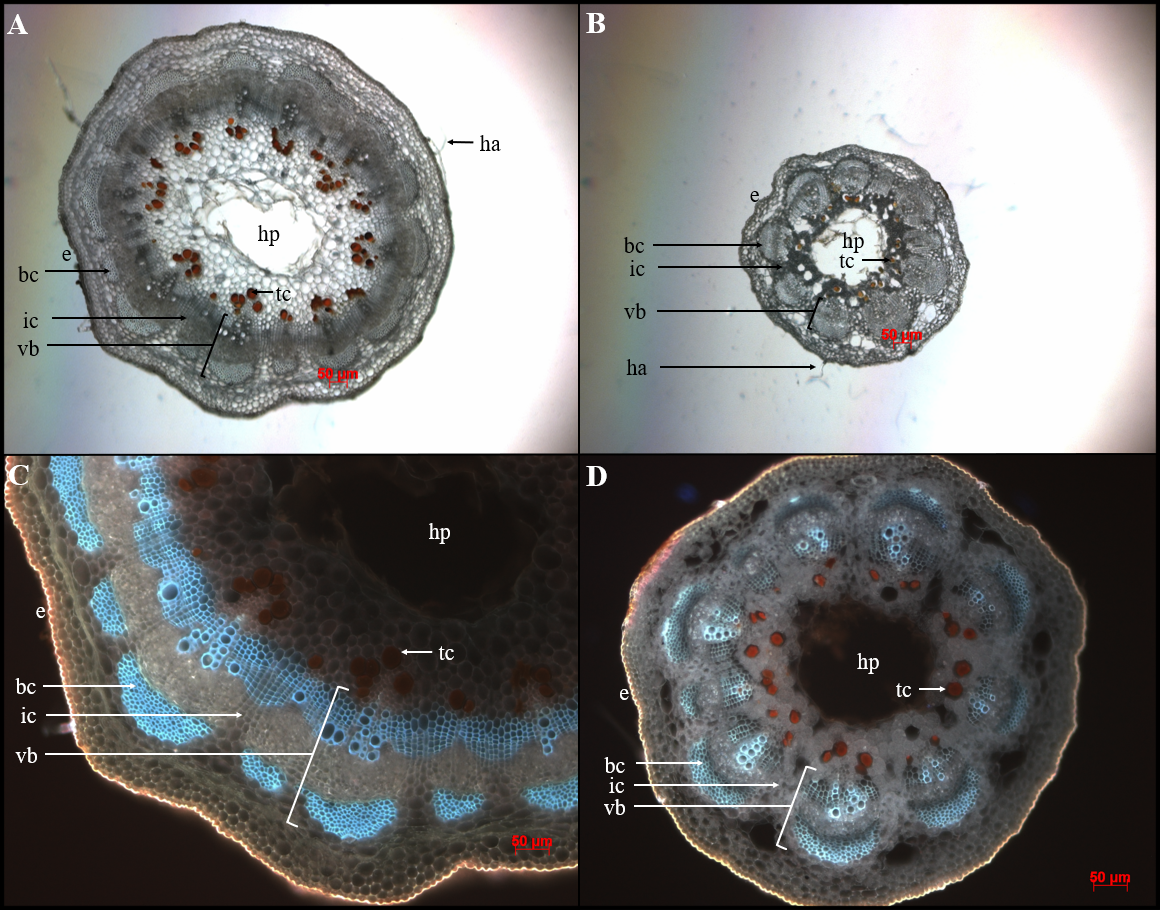
Arachis peg cross sections illustrating the anatomical features of a strong and weak peg. A) 13-2113 proximal peg cross section at 5x magnification; B) StenV10309 proximal peg cross section at 5x magnification; C) 13-2113 proximal peg cross section at 10x under UV light; D) StenV10309 proximal peg cross section at 10x under UV light, bc = bundle cap; e = epidermis; ha = epidermal hair; hp = hollow pith; ic = interfascicular cambium; tc = tannin cell; vb = vascular bundle. All scale bars are 50 μm.
Statistical Analysis.
One-way analysis of variance (ANOVA) was performed using JMP software (SAS Institute, Cary, NC) to determine the genotype effect on peg strength as well as peg anatomy according to the following parameters: peg area, bundle cap area, total bundle cap area, ratio of bundle cap area to peg area, bundle cap number, distance between bundle caps, total distance between bundle caps, and tannin cell count. ANOVA to identify genotype effect on peg anatomy was performed on proximal and distal data separately due to proximal and distal cross-sections originating from the same peg. This meant the cross-sections were not independent observations, since peg, not cross-section, was the experimental unit. For bundle cap area and distance between bundle caps, each data point was the mean for that cross-section so that the data would be balanced, because different genotypes had different numbers of bundle caps. Total bundle cap area and total distance between bundles caps were only measured for proximal peg cross sections, since distal cross sections were more degraded making it more difficult to see all the bundle caps clearly. Means of each parameter among the treatments were separated based on the Tukey’s Test (α = 0.05) results. Correlation analysis was performed with JMP software (SAS Institute) through pairwise comparisons to find Pearson product-moment correlations between peg strength and the peg anatomy parameters.
Results
Peg Strength.
Genotype had a significant effect on peg strength (Table 2). The general trend in peg strength was that, numerically, cultivated breeding lines and F1 hybrids had higher mean peg strength than the allotetraploids, or diploid Arachis species. A noticeable exception from this trend was Val, which had a mean detachment force of 3.91 N as compared to 5.30 N of 13-1014 and 4.24 N of 13-2113 (Fig. 2). However, Val had a much tighter distribution of peg strength than the cultivated controls. Unlike Val, four of the seven diploid Arachis species had significantly lower peg strength than the cultivated controls. In addition, the allotetraploids did not have peg strength significantly different than the diploids, from which they were derived. Furthermore, two of the seven F1 hybrids did not have significantly stronger pegs than the weakest species StenV10309, and four of the seven F1 hybrids did not have significantly stronger pegs than the next three weakest Arachis species, Card, Dur, and Sten410.
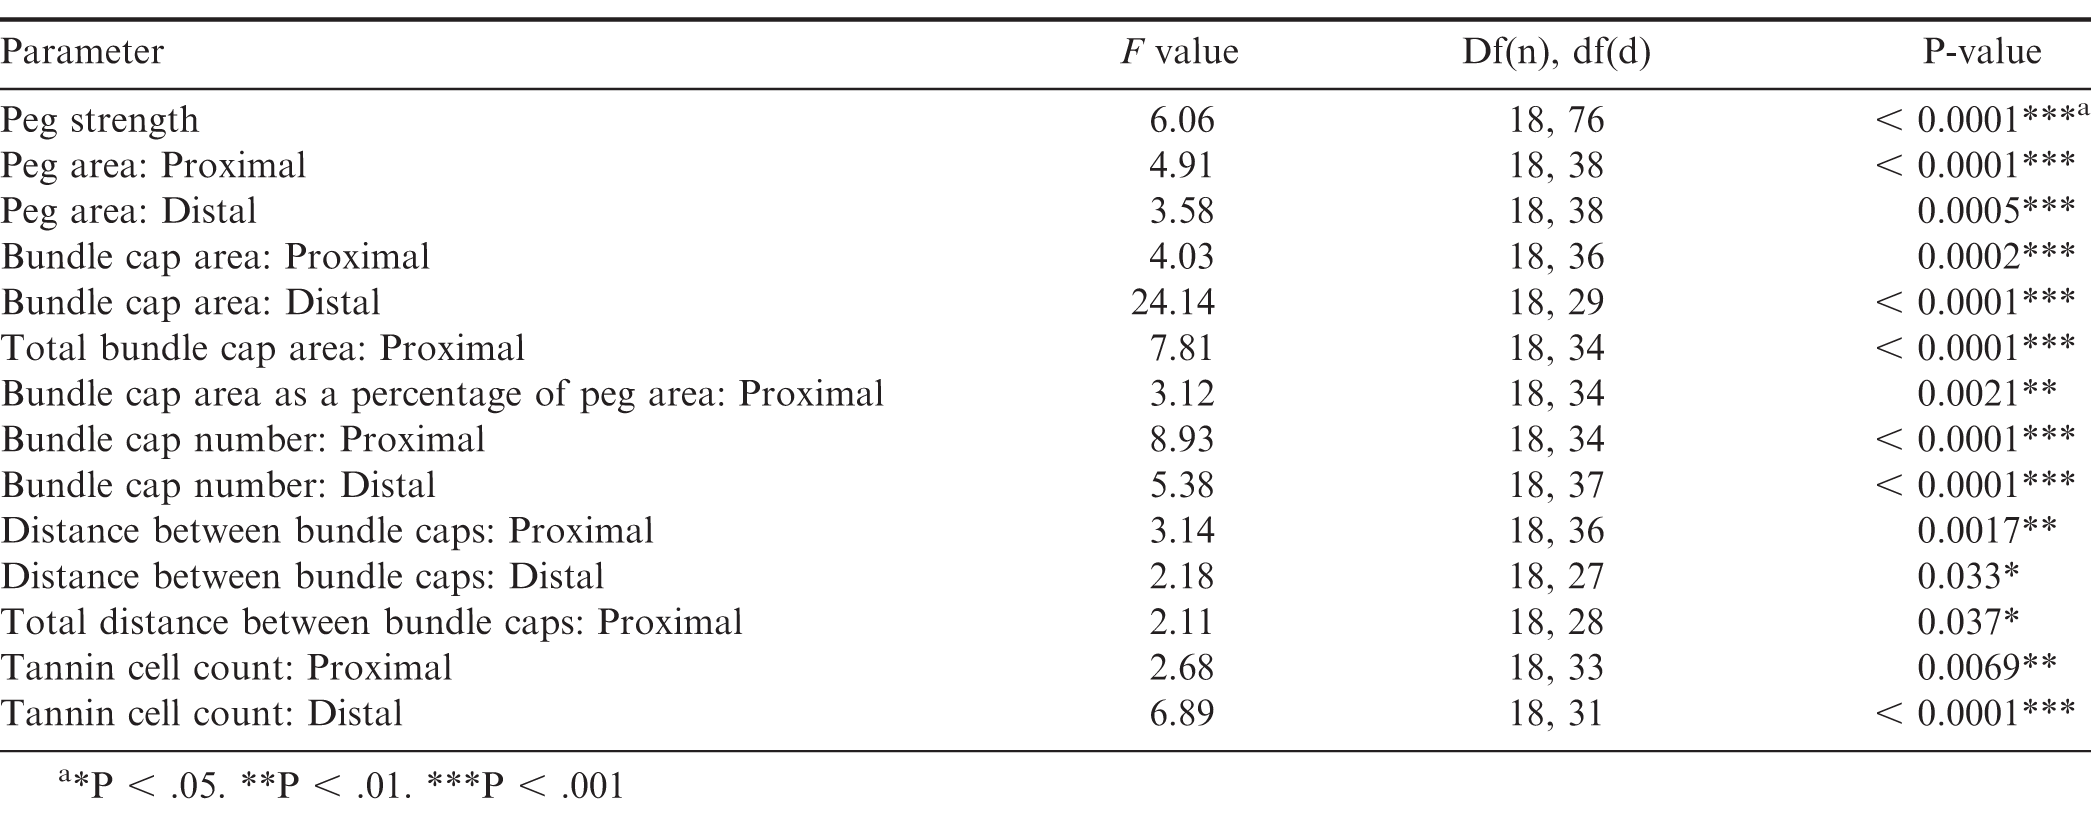
ANOVA output testing the genotype effect on Arachis peg strength as well as peg anatomical characteristics assessed using the following parameters: peg area, bundle cap area, total bundle cap area, bundle cap area as a percentage of peg area, bundle cap number, distance between bundle caps, and tannin cell count.
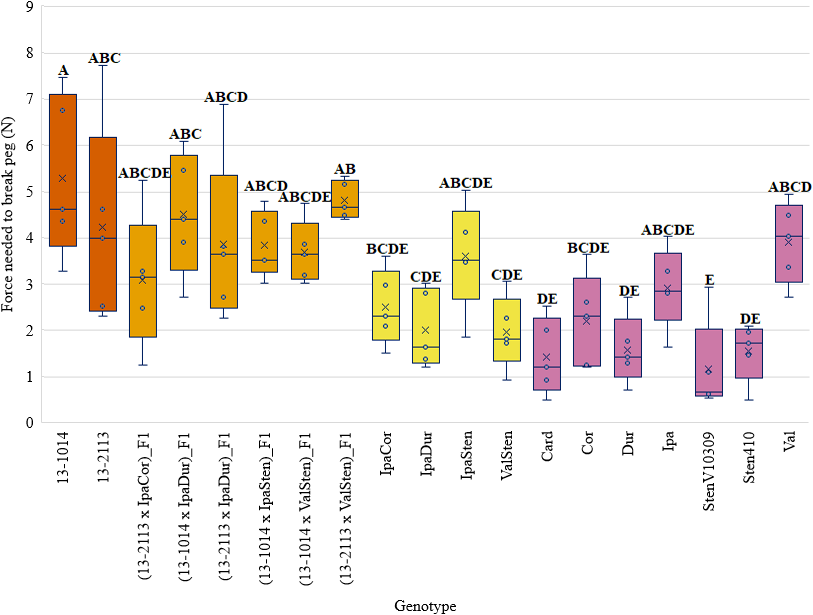
Peg strength of cultivated breeding lines (dark orange), (breeding line x allotetraploid) hybrids (light orange), allotetraploids (yellow), and wild Arachis diploids (pink).
Peg and Bundle Cap Area.
Genotype had a significant effect on proximal and distal peg area, proximal and distal mean bundle cap area, proximal total bundle cap area, and proximal total bundle cap area as a percentage of peg area (Table 2). Although both proximal and distal cross-sections had a similar trend, the proximal peg area data had more significant groups than the distal data (Fig. 3a, 3b). All the diploid Arachis species had significantly smaller proximal peg area than the cultivated breeding line 13-2113, except for Val (Fig. 1, 3). Only three of the seven Arachis species had significantly smaller proximal peg area compared to both cultivated breeding line controls. Card, the second weakest in peg strength, had the numerically smallest proximal peg area at 0.28 mm2, which is about half the mean peg area of Val at 0.63 mm2 and a third the mean peg area of 13-2113, the genotype with the largest peg area of 0.97 mm2. None of the F1 hybrids and allotetraploids differed significantly from the cultivated breeding lines for proximal peg area, except for IpaDur which was significantly smaller than 13-2113. On the contrary, except for (13-1014 x ValSten)_F1 and (13-2113 x ValSten)_F1, none of the F1 hybrids and allotetraploids differed significantly from Card, the genotype with the smallest proximal peg area.
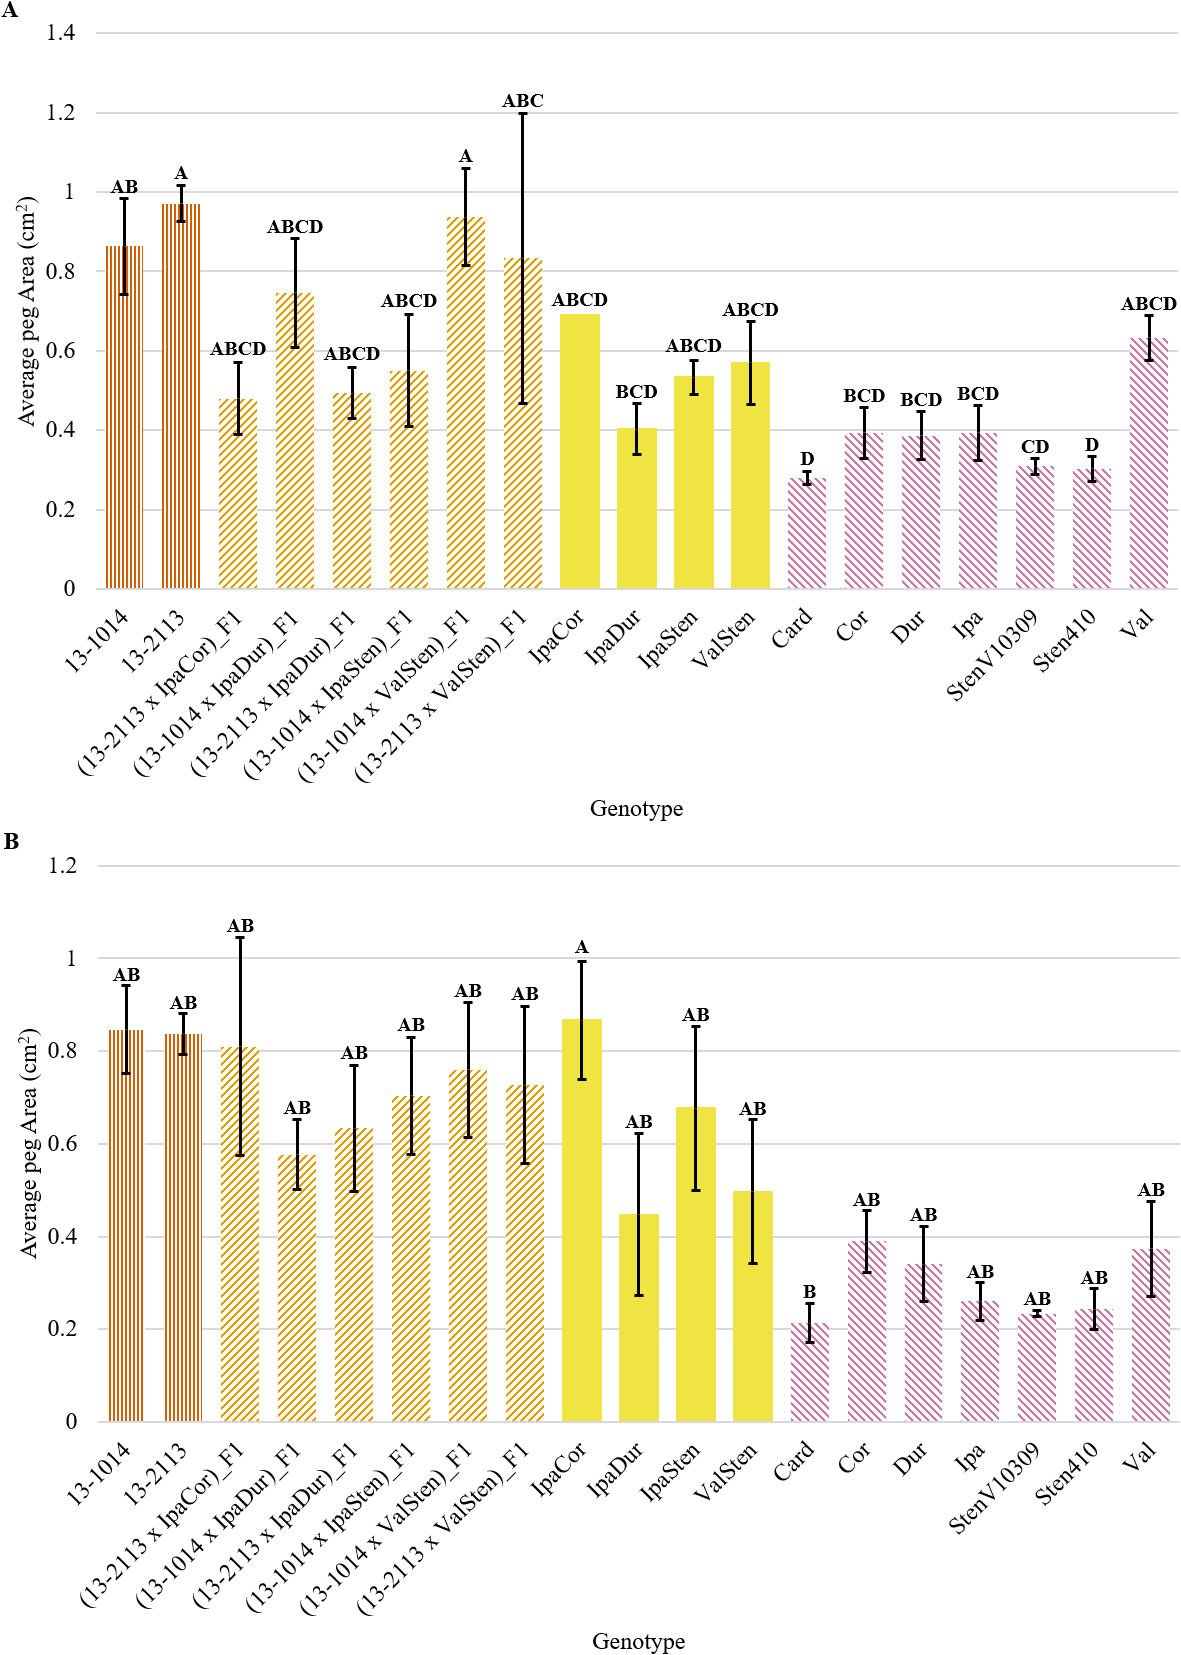
Peg area of cultivated breeding lines (dark orange, vertical stripes), (breeding line x allotetraploid) hybrids (light orange, right diagonal stripes), allotetraploids (solid yellow), and wild Arachis diploids (pink, left diagonal stipes). Error bars represent standard error. (A) Proximal. (B) Distal.
Bundle cap area for proximal and distal cross-sections was similar, with the cultivated controls having the largest bundle caps and some of the Arachis species having the smallest bundle caps, but in general, proximal cross-sections had greater mean bundle cap area than distal cross-sections (Fig. 4a, 4b). The cultivated breeding lines had the greatest proximal bundle cap areas at 3,483 and 4,203 μm2 for 13-1014 and 13-2113, respectively (Fig. 4a). The range in bundle cap area between the diploid Arachis species was large. Card had a mean bundle cap area of 1,149 μm2, a third of the mean bundle cap area of 13-1014, while Val had a mean bundle cap area of 2,290 μm2, two thirds the mean bundle cap area of 13-1014.
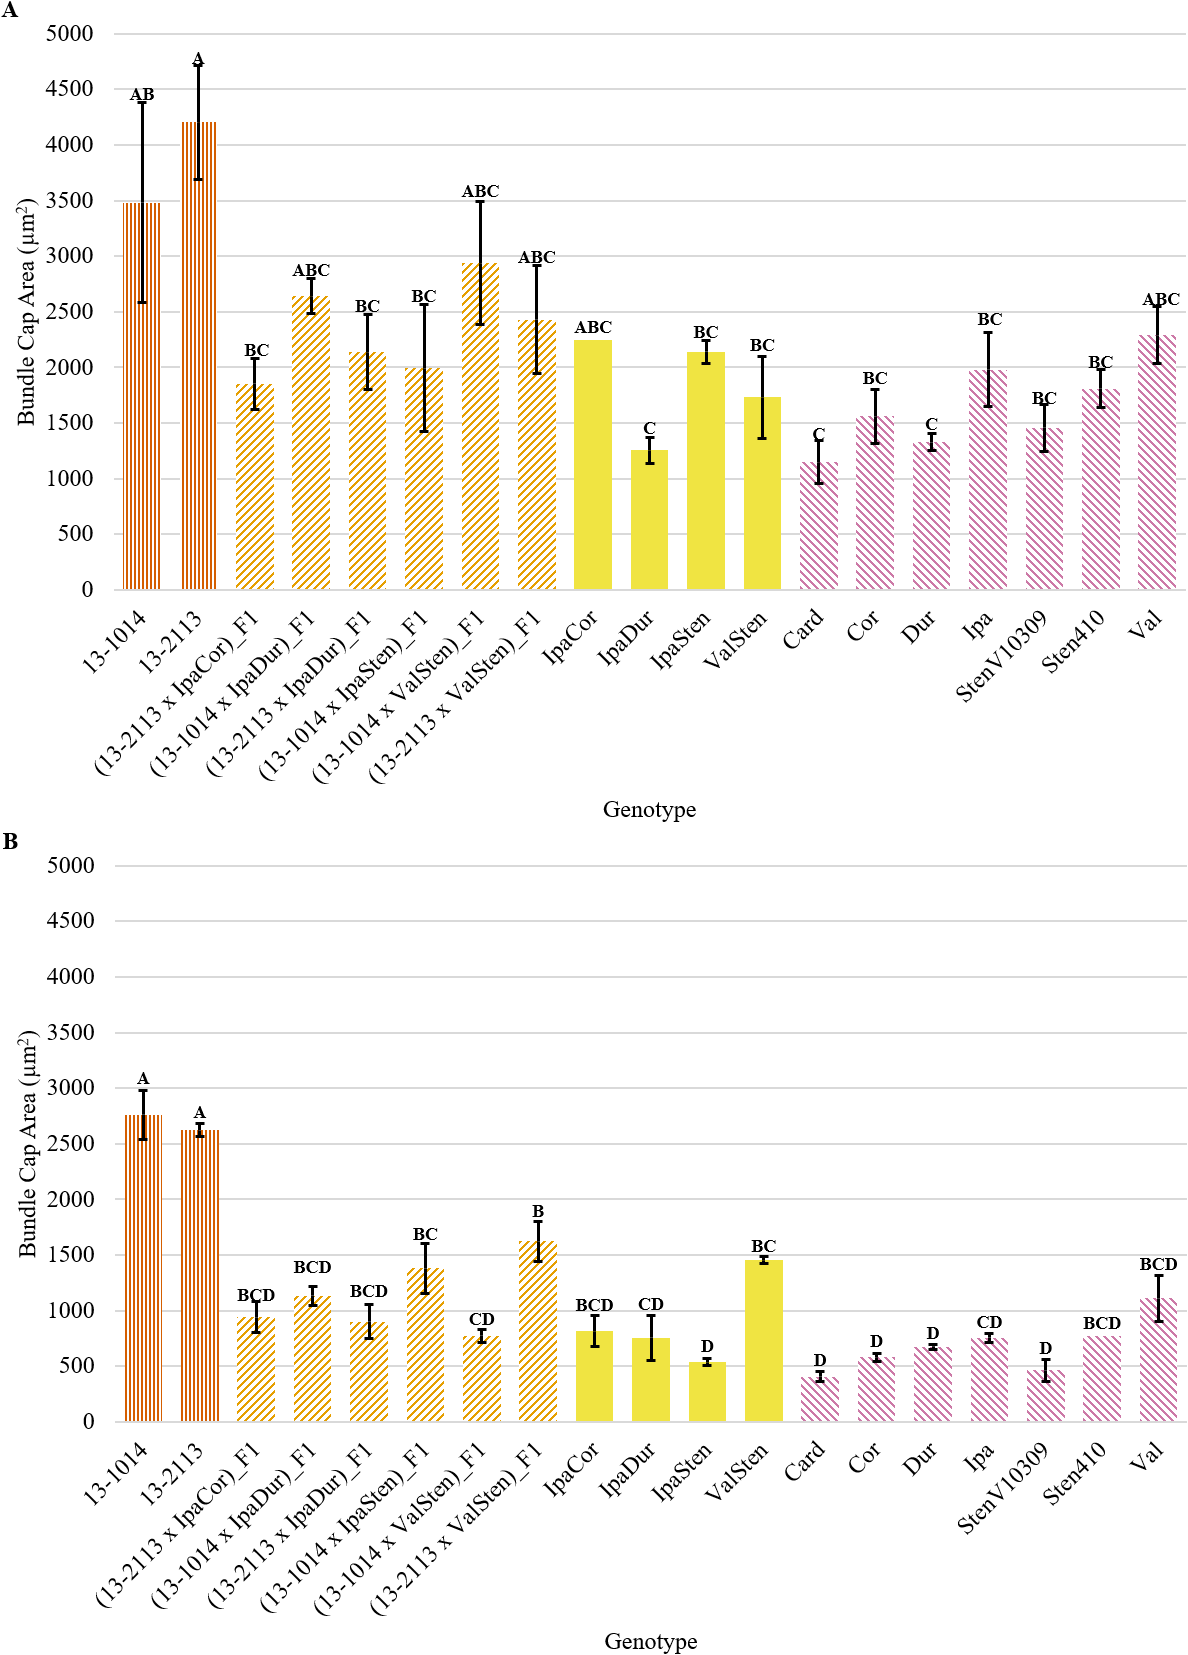
Bundle cap area of cultivated breeding lines (dark orange, vertical stripes), (breeding line x allotetraploid) hybrids (light orange, right diagonal stripes), allotetraploids (solid yellow), and wild Arachis diploids (pink, left diagonal stipes). Error bars represent standard error. (A) Proximal. (B) Distal.
Trends in proximal total bundle cap area and proximal bundle cap area were the same. Numerically, the cultivated breeding lines had the largest total bundle cap area at 75,213 μm2 for 13-2113 and 57,857 μm2 for 13-1014 (Fig. 5). Only IpaDur and ValSten as well as five of the seven diploid Arachis species had significantly lower total bundle cap areas than the cultivated controls. Val and Ipa had the greatest total bundle cap area of the Arachis species at 29,102 and 24,550 μm2, respectively. Card, Cor, and StenV10309 had the smallest total bundle cap areas at 13,562, 14,186, and 14,906 μm2, respectively, which are each about a fifth of the total bundle cap area of the cultivated control 13-2113.
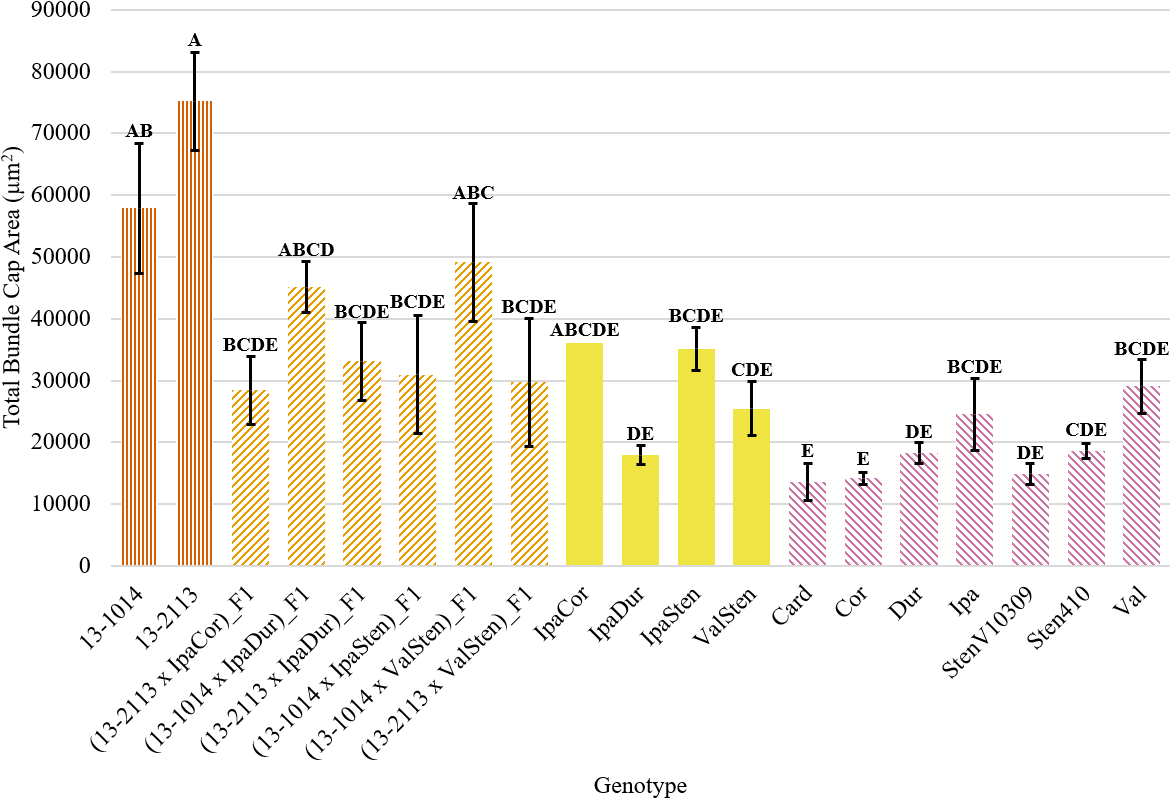
Total bundle cap area of proximal peg cross-sections of cultivated breeding lines (dark orange, vertical stripes), (breeding line x allotetraploid) hybrids (light orange, right diagonal stripes), allotetraploids (solid yellow), and wild Arachis diploids (pink, left diagonal stipes). Error bars represent standard error.
Despite a significant genotype effect on the total bundle cap area as a percentage of peg area, Tukey’s test did not parse out the genotypes into many distinct groupings. Only the bundle cap area as a percentage of total peg area for 13-2113 at 7.72 % and for ValSten, Cor, and Ipa at 4.49, 3.75, and 4.12 %, respectively, were found to be statistically different. All other genotypes were not significantly different (Fig. 6).
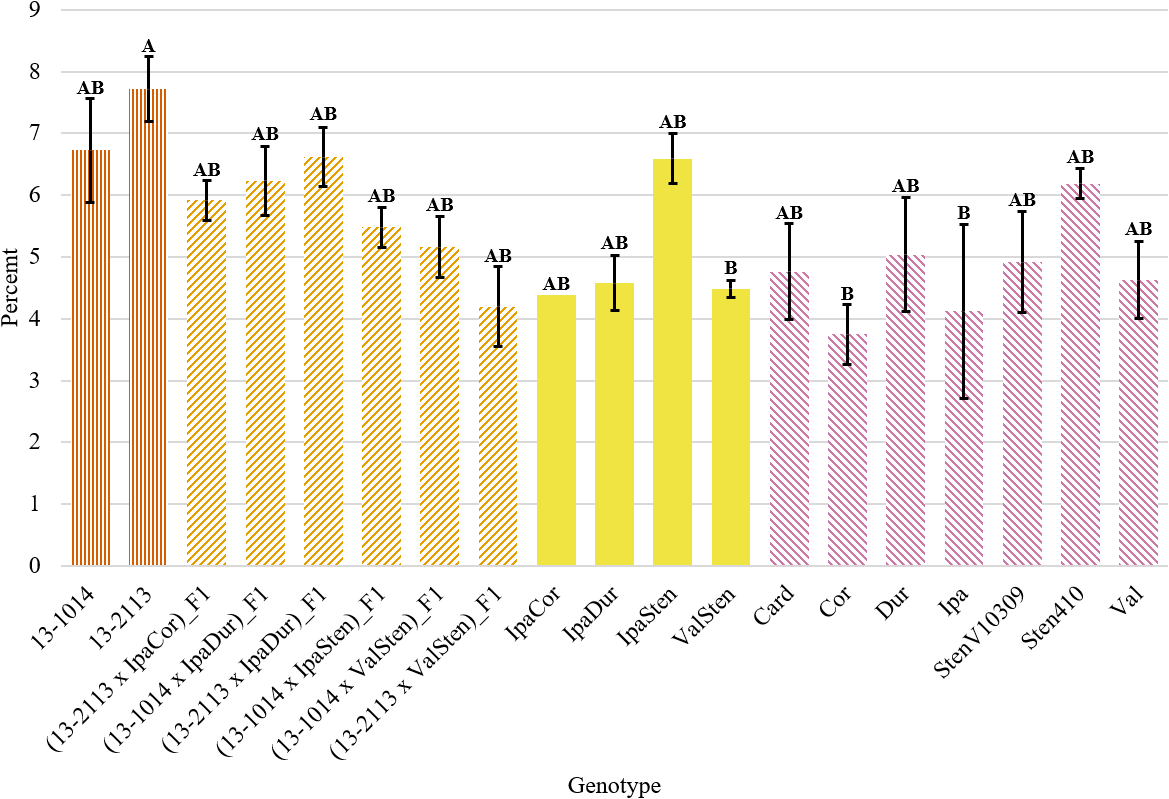
Total bundle cap area as a percentage of peg area for proximal peg cross-sections of cultivated breeding lines (dark orange, vertical stripes), (breeding line x allotetraploid) hybrids (light orange, right diagonal stripes), allotetraploids (solid yellow), and wild Arachis diploids (pink, left diagonal stipes). Error bars represent standard error.
Bundle Cap Number.
Genotype had a significant effect on proximal and distal bundle cap number (Table 2). Numerically, the general trend of bundle cap number was similar for proximal and distal cross-sections, in which the cultivated breeding lines had the greatest number of bundle caps and Cor had the smallest number of bundle caps (Fig. 7a, 7b). In general, proximal bundle cap counts were greater than distal counts. No genotypes had significantly different proximal and distal bundle cap counts except for five of the Arachis species (Fig. 7a). 13-1014 and 13-2113 had a mean of 18.0 and 17.3 proximal bundle caps, while Cor, the genotype with the fewest bundle caps at 9.3, had about half of their bundle cap counts. The Arachis species with the most bundle caps were Dur and Ipa with a mean of 13.3 and 14.0 proximal bundle caps and 10.3 and 10.3 distal bundle caps, respectively.
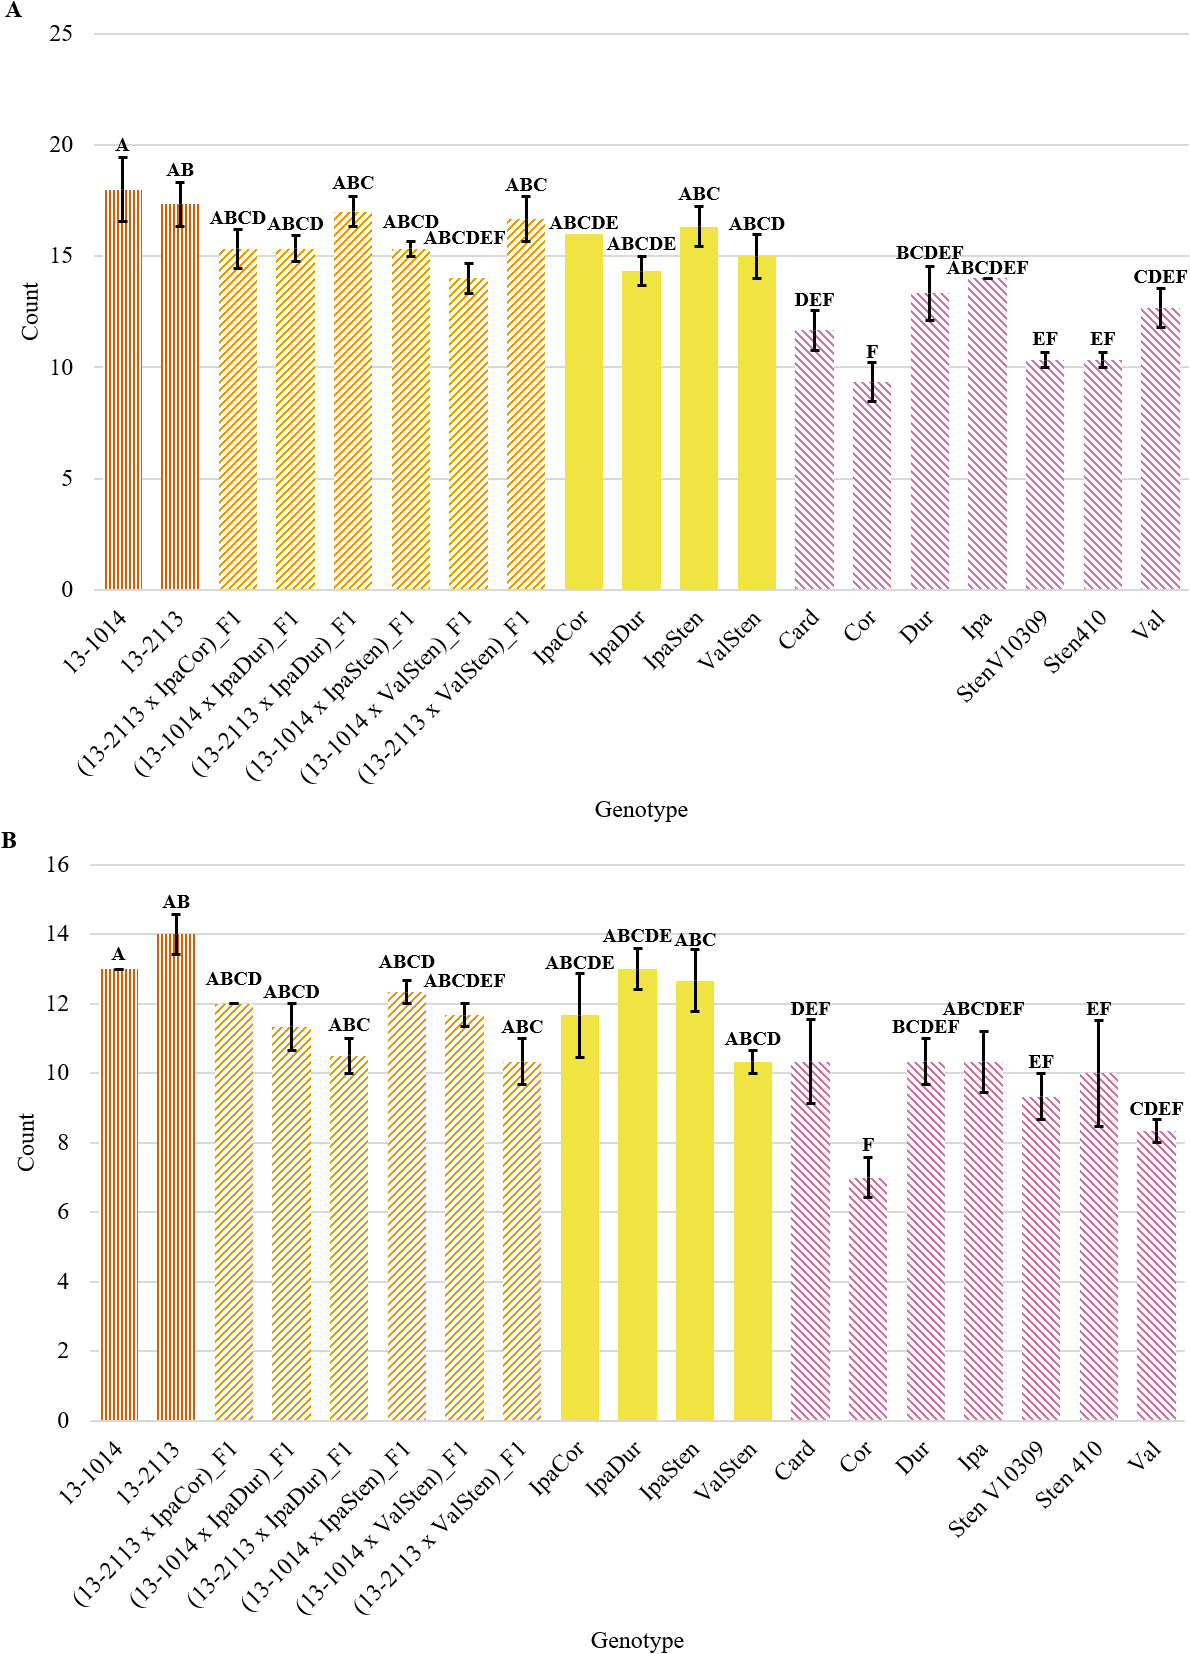
Bundle cap count of cultivated breeding lines (dark orange, vertical stripes), (breeding line x allotetraploid) hybrids (light orange, right diagonal stripes), allotetraploids (solid yellow), and wild Arachis diploids (pink, left diagonal stipes). Error bars represent standard error. (A) Proximal. (B) Distal.
Distance between bundle caps.
Genotype had a significant effect on distance between bundle caps in proximal and distal sections and on total distance between bundle caps in proximal sections (Table 2). In general, the mean distance between bundle caps was greater for distal cross-sections than proximal cross-sections. Despite genotype being a significant indicator of proximal distance between bundle caps, Tukey’s test differentiated the genotypes into just two significance groups (Fig. 8). Cor had a significantly higher mean distance between bundle caps in proximal peg sections than 13-2113, (13-2113 x IpaCor)_F1, (13-2113 x IpaDur)_F1, (13-1014 x IpaSten)_F1, and IpaSten. All genotypes were the same for distance between bundle caps in distal cross-sections and total distance between bundle caps in proximal cross-sections.
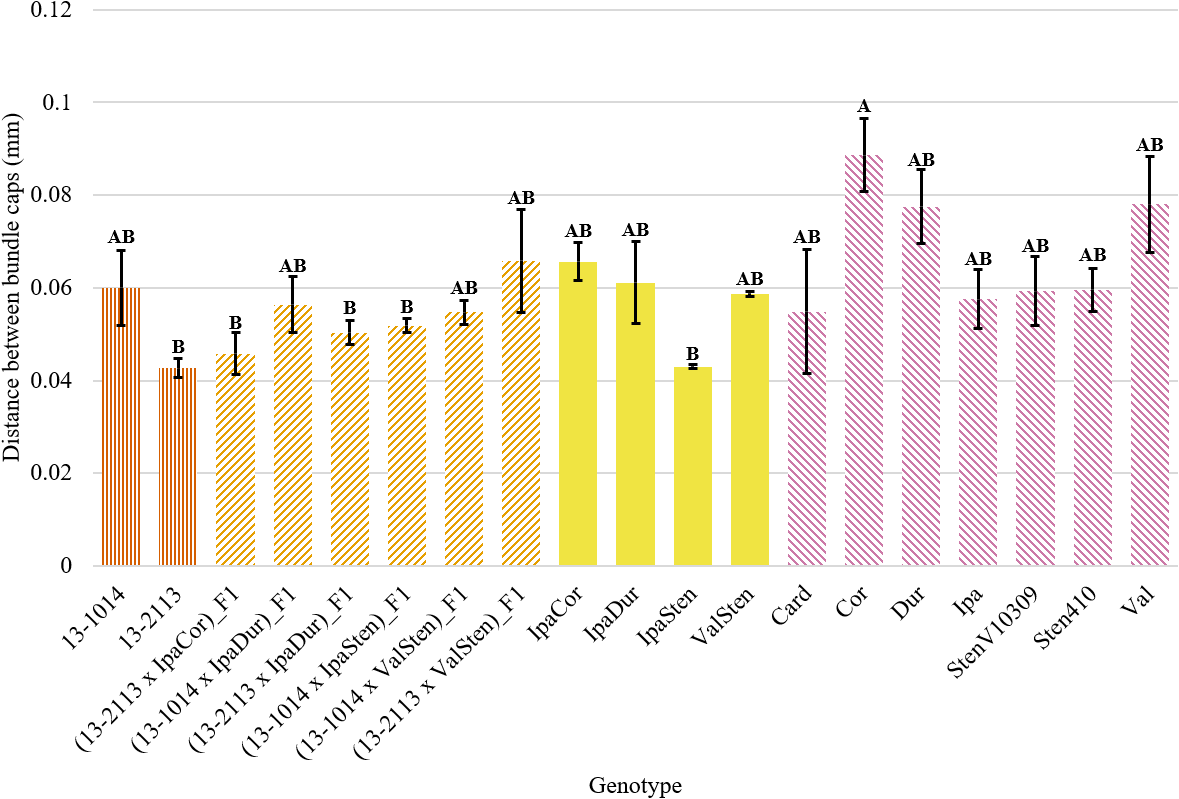
Distance between bundle caps of proximal peg cross-sections of cultivated breeding lines (dark orange, vertical stripes), (breeding line x allotetraploid) hybrids (light orange, right diagonal stripes), allotetraploids (solid yellow), and wild Arachis diploids (pink, left diagonal stipes). Error bars represent standard error.
Tannin Cell Count.
Genotype had a significant effect on tannin cell count per cross-section for both distal and proximal cell counts; however, the trends in tannin cell count differed between distal and proximal tannin cell counts (Table 2). In general, distal peg cross-sections had two to three times as many tannin cells than proximal peg cross-sections (Fig. 9a and 9b). For proximal cross-sections, the cultivated breeding lines had the numerically highest tannin cell counts at 26.0 and 25.7 for 13-2113 and 13-1014, respectively; however, (13-1014 x ValSten)_F1, IpaSten, ValSten, Card, and Val, were not significantly different from the cultivated controls. The four genotypes with the numerically lowest number of tannin cells were IpaDur, Ipa, Dur, and (13-2113 x IpaDur)_F1 with 0.5, 1.0, 2.0, and 2.0 tannin cells, respectively. For distal cross-sections, 13-2113 had the highest mean tannin cell count of 70.3. 13-1014 had a mean of 45.3 tannin cells and was only significantly greater than (13-2113 x ValSten) and StenV10309.
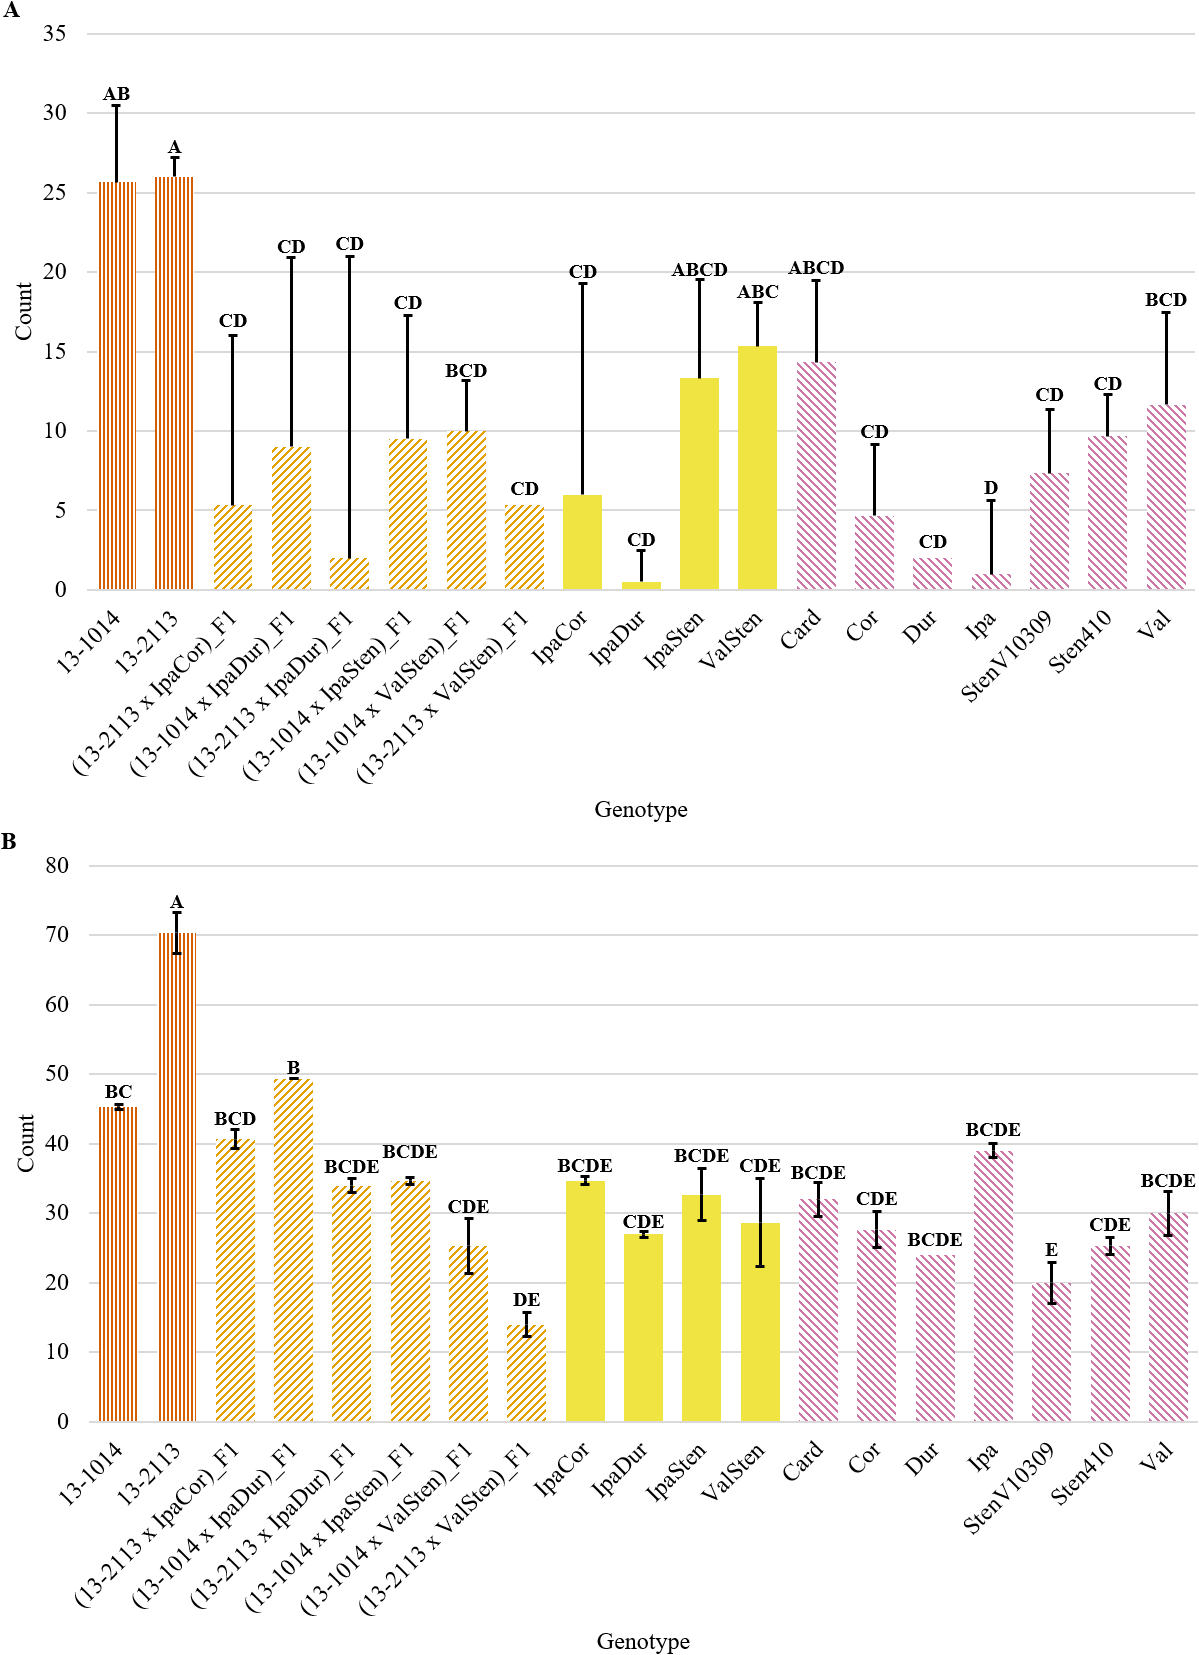
Tannin cell count per cross-section of cultivated breeding lines (dark orange, vertical stripes), (breeding line x allotetraploid) hybrids (light orange, right diagonal stripes), allotetraploids (solid yellow), and wild Arachis diploids (pink, left diagonal stipes). Error bars represent standard error. (A) Proximal. (B) Distal.
Correlation of peg strength and anatomy parameters.
Peg strength was correlated with approximately half of the peg anatomy parameters (Table 3). The highest correlations with peg strength were, proximal peg area (R = 0.80), proximal bundle cap area (R = 0.78), total proximal bundle cap area (R = 0.75), and proximal bundle cap number (R = 0.74). Peg strength was not correlated to total bundle cap area as a percentage of peg area, distal bundle cap number, proximal or distal distance between bundles, proximal total distance between bundles, or proximal or distal tannin cell count (Table 3). Both proximal and distal peg area were correlated with one another and proximal and distal bundle cap area, total proximal bundle cap area, and proximal and distal bundle cap count, yet neither were correlated with total proximal bundle cap area as a percentage of peg area.
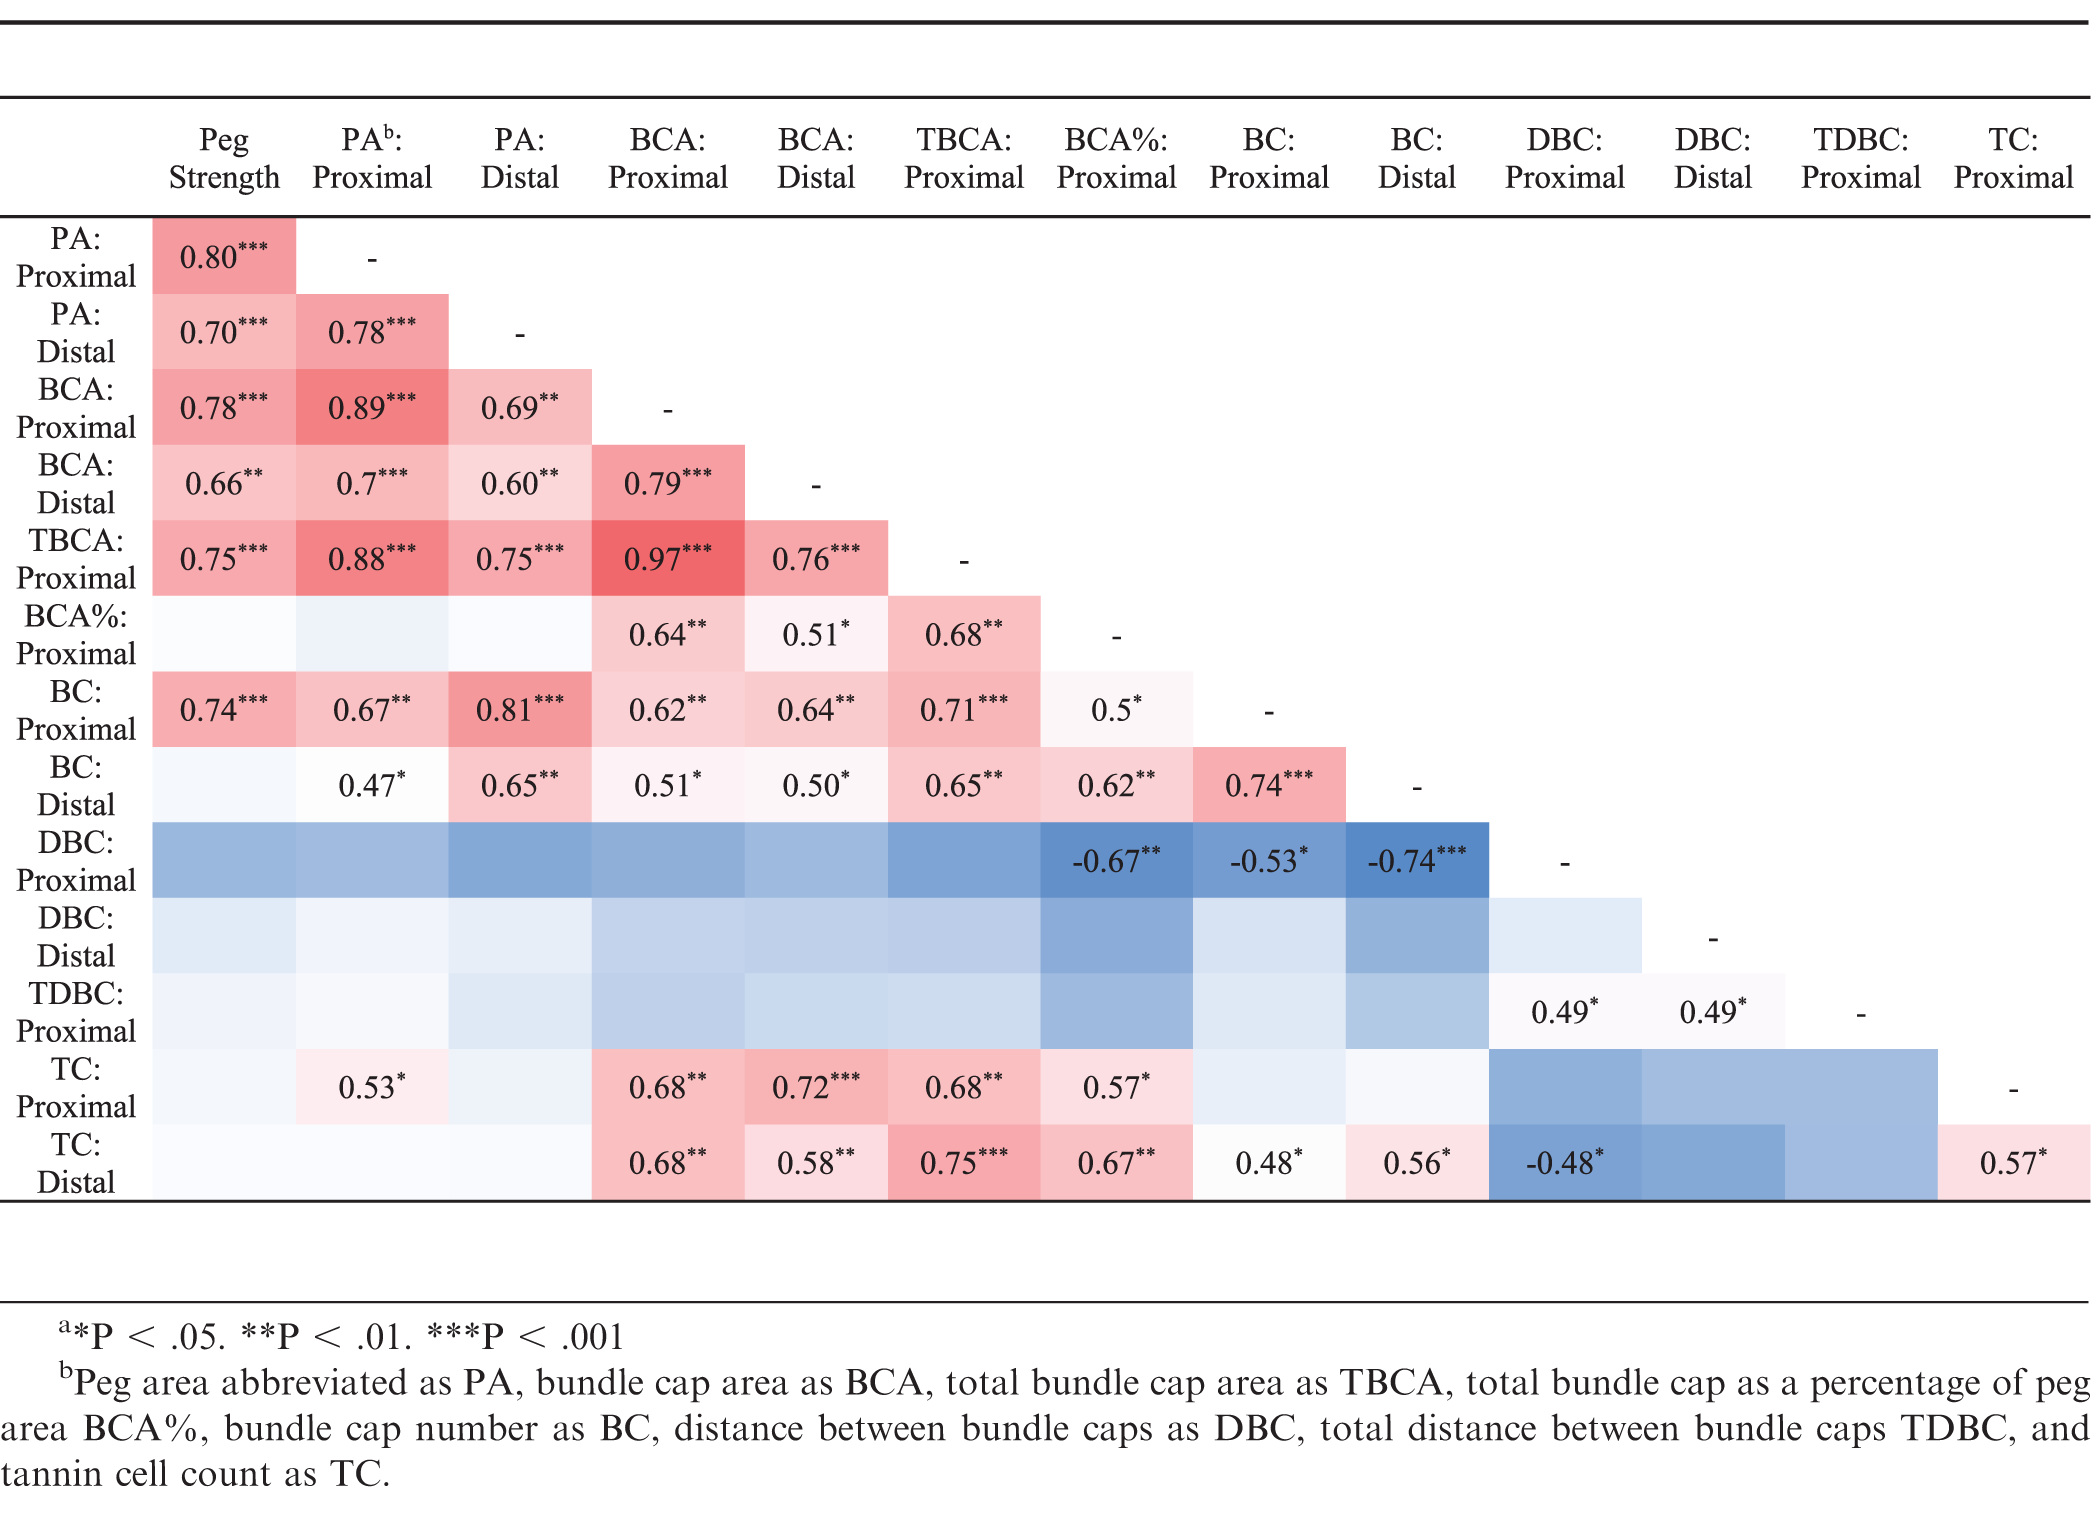
Pairwise comparisons of peg strength and peg anatomy parameters. Only significant correlations are shown.
Discussion
Peg strength has a direct impact on harvest efficiency since weak pegs tend to break off when the peanuts are inverted in the field. The weakness in peg strength among the wild species could compromise yield which should be selected against while introgressing other beneficial alleles from wild species. The most important findings in this study were that genotype had a significant effect on peg strength and that while most of the allotetraploids and diploid Arachis species were significantly weaker than breeding line 13-1014, peg strength of F1 hybrids were not significantly different from the cultivated breeding lines. Therefore, peg strength was recovered in the F1 hybrids upon crossing. This suggested that weak peg strength in the wild Arachis species may be recessive, and it will likely segregate among the progenies of interspecific breeding populations.
In Arachis materials, peg strength was strongly correlated with peg diameter, bundle cap area, and proximal bundle cap number. The finding that bundle cap area and bundle cap number were correlated with peg strength agreed with previous reports (Thomas et al., 1983; Tiwari et al., 1988). However, Tiwari et al. (1988) also found that peg strength was not correlated with peg diameter, but peg area–a direction function of peg diameter–was the anatomical characteristic with the greatest correlation to peg strength found in this study. This difference might be due to the inclusion of wild, Arachis species, which had peg areas about half that of the cultivated breeding lines. The increased variation introduced by Arachis species may have enabled a difference in peg area to be detected. Another explanation could be that the current study was able to capture peg area more precisely by taking a photo with the microscope and then analyzing the area with Assess 2.0 (APS Press) instead of measuring peg area through an eyepiece micrometer (Tiwari et al., 1988). In the current study, proximal peg area had the highest correlation with peg strength (R = 0.80), and the other peg anatomical characteristics that were correlated with peg strength were also highly correlated with proximal peg area. Therefore, only one of these peg anatomical characteristics needs to be measured to predict peg strength. Bundle cap area was the best predictor of peg strength (R = 0.78) in this study and was also correlated to peg strength by Tiwari et al. (1988) and Thomas et al. (1983).
The results of this study also differ from those reported by Thomas et al. (1983), who found that 2 to 4 rows of interfascicular cambium and parenchyma cells separated vascular bundles in weak pegs as compared to 3 to 5 in strong pegs. In this study, the distance between bundle caps was measured instead of counting rows of cells because it was easier and thus more accurate to distinguish the ends of bundle caps than to distinguish the rows of cells. However, the current study did not find the distance between bundle caps to be correlated with peg strength. The difference between this study and Thomas et al. (1983) may be due to capturing this anatomical character by different methods—counting rows of cells versus measuring a distance—since the cells between bundle caps may be different sizes in different genotypes. In addition, Thomas et al. (1983) observed that strong pegs had crescent-shaped bundle caps. While this study did not seek to quantify bundle cap shape, this trend of strong pegs having crescent-shaped bundle caps was not anecdotally observed. In Fig. 1, the genotype with the weakest pegs, StenV10309 had bundle caps that were more crescent-shaped than those of 13-2113, the cultivated breeding line with the second strongest pegs.
An unexpected but important result to emphasize is that Val had a peg strength of 3.9 N that was comparable to the cultivated breeding lines’ peg strengths of 5.3 and 4.2 N. While in general, peg strength of the Arachis species was low, the relatively high peg strength of Val suggests that some Arachis species may have beneficial alleles for peg strength that could be used for cultivar improvement. A peg strength of 3.9 N is low as compared to peanut cultivars (Thomas et al., 1983), but there may be wild Arachis alleles that increase peg strength in cultivars when in the right genetic background. This claim is encouraged by the finding of Fonceka et al. (2012) that identified wild Arachis alleles that increased seed size in a BC2F1 population, despite wild Arachis species having small seeds.
The mean peg strengths of the allotetraploids were similar to those of the wild Arachis species, and three of the four allotetraploids were significantly weaker than the breeding line 13-1014. In addition, all of the allotetraploids had statistically similar peg strengths to the weakest Arachis species, StenV10309. It was hypothesized that the peg strength of the allotetraploids would be greater than the wild, Arachis species if peg strength was partly due to increased peg area. It was also thought that the allotetraploids would have larger bundle caps than the diploid Arachis species because of the gigas effect, in which increased chromosome content leads to larger cell size and larger plant tissues. Leal-Bertioli et al. (2017) compared the morphological characteristics of multiple allotetraploids with wild Arachis species and cultivated peanut and found that allotetraploids had increased plant size and higher photosynthetic capacity but not increased seed size or mass. Peg strength may be an additional characteristic to seed size and mass that allotetraploids do not gain due to increased ploidy level. Improved peg strength in peanut cultivars is likely due to selection for alleles that increase peg strength. Also, while the allotetraploids had numerically larger proximal peg areas than the Arachis species (except for Val) this difference was not found to be significant (P > 0.05). This suggested that increased ploidy level may not increase peg area or peg strength.
A limitation of this study was small sample size, which was caused by few pods remaining attached to plants of the Arachis species. Although there were more than 10 plants per genotype, pegs tend to break during harvest leaving mature pods and seeds under the soil resulting in few pods attached to the plant. Coupled with the naturally indeterminate maturity of peanut, the weak peg strength resulted in a great difficulty in finding pods at the right maturity. A larger sample size would have likely further distinguished the peg strength and peg anatomical characteristics of the different breeding materials. Despite this limitation, significant differences in peg strength and anatomy were detected with sufficient clarity to correlate peg strength and peg anatomy parameters and to show that peg strength comparable to cultivated peanut is recovered in the F1 hybrids. This finding should encourage further use of Arachis species as donors of disease resistance in peanut breeding programs.
Conclusions
Cultivated breeding lines had higher peg strength than allotetraploids and Arachis species in general. Peg strength was positively and highly correlated with proximal and distal peg area, proximal and distal mean bundle cap area, proximal total bundle cap area, and proximal bundle cap number. Since peg strength comparable to the peanut breeding lines was recovered in the F1 hybrids, this suggests that few backcrosses may be needed to select against weak peg strength. Furthermore, peanut breeders will indirectly select against weak peg strength as they select for elite yield potential in their breeding programs, so special attention to weak peg strength is unnecessary. In addition, there may be positive alleles for peg strength in some wild, Arachis species such as Val, that could be introgressed into cultivated peanut and could result in new yield improvements. Peanut breeders should be encouraged that the weak peg strength of Arachis species should not hinder the introgression of beneficial alleles from wild, Arachis species into peanut cultivars.
Acknowledgements
This work was supported by the National Science Foundation (grant # MCB-1543922) and by the AFRI NIFA Fellowships Grant Program: Predoctoral Fellowships project accession no. 1019105 from the USDA National Institute of Food and Agriculture. The authors would like to express their appreciation to Dr. Dongying Gao of the Center for Applied Genetic Technologies, University of Georgia, Athens, Georgia, for producing and sharing the ValSten diploid hybrid cutting and to Dr. Jason Wallace of the Department of Crop and Soil Sciences, University of Georgia, Georgia, for assisting in the approach to data analysis.
Literature Cited
Anco, D., and Thomas. J.S. 2020. Determining harvest maturity, pp. 64– 65. In: Peanut Money-Maker: 2020 Production Guide. Clemson Cooperative Extension, Clemson, South Carolina.
Bantilan, M.C.S., Deb, U.K., and Nigam. S.N. 2003. Impacts of genetic improvement in groundnut, pp. 293– 314. In Evenson R.E. and Gollin D. (eds.) Crop variety improvement and its effect on productivity. CABI, Wallingford, UK.
Bauman, R.W. and Norden. A.J. 1971. Effect of growth regulators and reproductive characteristics of six peanut genotypes. J. Amer. Peanut Res. Educ. Assoc. 3: 75– 86.
Beckman, C.H. 2000. Phenolic-storing cells: Keys to programmed cell death and periderm formation in wilt disease resistance and in general defence responses in plants? Physiol. Mol. Plant Path. 57 (3): 101– 110.
Bertioli, D.J., Cannon, S.B., Froenicke, L., Huang, G., Farmer, A.D., Cannon, E.K., Liu, X., Gao, D., Clevenger, J., Dash, S., Ren, L., Moretzsohn, M.C., Shirasawa, K., Huang, W., Vidigal, B., Abernathy, B., Chu, Y., Niederhuth, C.E., Umale, P., Araújo, A.C., Kozik, A., Do Kim, K., Burow, M.D., Varshney, R.K., Wang, X., Zhang, X., Barkley, N., Guimarães, P.M., Isobe, S., Guo, B., Liao, B., Stalker, H.T., Schmitz, R.J., Scheffler, B.E., Leal-Bertioli, S.C., Xun, X., Jackson, S.A., Michelmore, R., and Ozias-Akins. P. 2016. The genome sequences of Arachis duranensis and Arachis ipaensis, the diploid ancestors of cultivated peanut. Nat. Genet. 48: 438– 446.
Chapin, J.W. and Thomas. J.S. 2005. Effect of fungicide treatments, pod maturity, and pod health on peanut peg strength. Peanut Sci. 32: 119– 125.
Church, G.T., Simpson, C.E., Burow, M.D., Paterson, A.H., and Starr. J.L. 2000. Use of RFLP markers for identification of individuals homozygous for resistance to Meloidogyne arenaria in peanut. Nematology 2: 575– 580.
Chu, Y., Gill, R., Clevenger, J., Timper, P., Holbrook, C.C., and Ozias-Akins. P. 2016. Identification of rare recombinants leads to tightly linked markers for nematode resistance in peanut. Peanut Sci. 43: 88– 93.
Clevenger, J.P., Korani, W., Ozias-Akins, P., and Jackson. S.A. 2018. Haplotype-based genotyping in polyploids. Front. Plant Sci. 9: 564.
Fonceka, D., Tossim H.-A., Rivallan, R., Vignes, H., Faye, I., Ndoye, O., Moretzsohn, M.C., Bertioli, D.J., Glaszmann, J.-C., Courtois, B., and Rami. J.-F 2012. Fostered and left behind alleles in peanut: Interspecific QTL mapping reveals footprints of domestication and useful natural variation for breeding. BMC Plant Biol. 12: 26.
Food and Agriculture Organization Corporate Statistical Database (FAOSTAT). 2018. Crops. Retrieved from http://faostat3.fao.org/home/
Guimón, J. and Guimón. P. 2012. How ready-to-use therapeutic food shapes a new technological regime to treat child malnutrition. Technol. Forecast. Soc. Change 79 (9): 1319– 1327.
Holbrook, C.C., Brenneman, T.B., Stalker, T.H., Johnson, W.C., Ozias-Akins, P., Chu, Y., Vellidis, G., and McClusky. D. 2015. Peanut, pp. 173– 194. In Smith, S., Diers, B., Specht, J., and Carver B. (eds.) Yield Gains in Major U.S. field crops. ASA-CSSA-SSSA, Madison, WI.
Korani, W., Clevenger, J.P., Chu, Y., and Ozias-Akins. P. 2019. Machine learning as an effective method for identifying true single nucleotide polymorphisms in polyploid plants. Plant Genome 12: 180023.
Leal-Bertioli, S.C.M., Moretzsohn, M.C., Santos, S.P., Brasileiro, A.C.M., Guimarães, P.M., Bertioli, D.J., and Araujo. A.C.G. 2017. Phenotypic effects of allotetraploidization of wild Arachis and their implications for peanut domestication. Am. J. Bot. 104 (3): 379– 388.
Li, W., Berlyn, G.P., and Ashton. M.S. 1996. Polyploids and their structural and physiological characteristics relative to water deficit in Betula papyrifera (Betulaceae). Am. J. Bot. 83 (1): 15– 20.
Moretzsohn, M.C., Gouvea, E.G., Inglis, P.W., Leal-Bertioli, S.C.M., Valls, J.F.M., and Bertioli. D.J. 2013. A study of the relationships of cultivated peanut (Arachis hypogaea) and its most closely related wild species using intron sequences and microsatellite markers. Ann. Bot. 111 (1): 113– 126.
Ni, Z., Kim, E.D., Ha, M., Lackey, E., Liu, J., Zhang, Y., Sun, Q., and Chen. Z.J. 2009. Altered circadian rhythms regulate growth vigour in hybrids and allopolyploids. Nature 457: 327– 331.
Ramsey, J., and Schemske. D.W. 1998. Pathways, mechanisms, and rates of polyploid formation in flowering plants. Annu. Rev. Ecol. Evol. S. 29: 467– 501.
Srinivasan, R., Abney, M.R., Culbreath, A.K., Kemerait, R.C., Tubbs, R.S., Monfort, W.S., and Pappu. H.R. 2017. Three decades of managing Tomato spotted wilt virus in peanut in southeastern United States. Virus. Res. 15 (241): 203– 2121. (doi:https://doi.org/10.1016/j.virusres. 2017.05.016)
Sosa, J.M., Huber, D.E., Welk, B., and Fraser. H.L. 2014. Development and application of MIPAR™: A novel software package for two- and three-dimensional microstructural characterization. Integr. Mater. Manuf. Innov. 3: 123– 140.
Sorensen, R.B., Lamb, M.C., and Butts. C.L. 2015. Can peg strength be used as a predictor for pod maturity and peanut yield? Peanut Sci. 42 (2): 92– 99.
Sorensen, R.B., Nuti, R.C., Holbrook, C.C., and Chen. C.Y. 2017. Peanut peg strength and associated pod yield and loss by cultivar. Peanut Sci. 44 (2): 77– 82.
Stalker, H.T. 2017. Utilizing wild species for peanut improvement. Crop Sci. 57: 1102– 1120.
Stalker, H.T., Tallury, S.P., Ozias-Akins, P., Bertioli, D., and Leal Bertioli. S.C. 2013. The value of diploid peanut relatives for breeding and genomics. Peanut Sci. 40 (2): 70– 88.
Stalker, H.T., Tallury, S.P., Seijo G.R., and Leal-Bertioli. S.C. 2016. Biology, speciation, and utilization of peanut species, pp. 27– 66. In Stalker H.T. and Wilson R.F. (eds.) Peanuts: Genetics, processing, and utilization. Elsevier, Amsterdam.
Stalker, H.T., and Campbell. V.W. 1983. Resistance of wild species of peanut to an insect complex. Peanut Sci. 10 (1): 30– 33.
Suchoszek-Lukaniuk, K., Jaromin, A., Korycińska, M., and Kozubek. A. 2011. Health benefits of peanut (Arachis hypogaea L.) seeds and peanut oil consumption, pp. 873– 881. In: Preedy, V.R., Watson, R.R., and Patel V.B. (eds.) Nuts and seeds in health and disease prevention. Elsevier, Amsterdam.
Tal, M. 1980. Physiology of polyploids, pp. 61– 75. In Lewis W.H. (ed.) Polyploidy: Biological relevance. Plenum, New York, NY.
Thomas, R.J., Pettit, R.E., Taber, R.A., and Jones. B.L. 1983. Peanut peg strength: Force required for pod detachment in relation to peg structure. Peanut Sci. 10: 97– 101.
Tiwari, S.P., Murthy, T.G.K., Johnson, G.K., and Varmoda. D.L. 1988. Path-coefficient analysis of anatomical characters affecting peg strength in groundnut. Euphytica 39: 119– 121. (doi:https://doi.org/10.1007/BF00039863)
Troeger, J.M., Williams, E.J., and Butler. J.L. 1976. Factors affecting peanut peg attachment force. Peanut Sci. 3: 37– 40.
Notes
- Institute of Plant Breeding, Genetics and Genomics, University of Georgia, Athens, GA, USA. [^]
- Horticulture Department, University of Georgia, Tifton, GA, USA. [^]
- Department of Crop and Soil Sciences, North Carolina State University, Raleigh, NC, USA. [^]
- USDA- Agricultural Research Service, Crop Genetics and Breeding Research Unit, Tifton, GA, USA. [^] *Corresponding author Email: pozias@uga.edu
Author Affiliations