

Introduction
Plant microclimate conditions have frequently been reported to significantly influence development of diseases in many crops (Blad et al., 1978; Kora et al., 2005; Weiss et al., 1980b; Weiss et al., 1980a). Many studies have demonstrated that plant architecture including canopy structure and density can affect plant microclimates and consequently influence development of diseases (Bailey and Brune 1997; Blad et al., 1978; Dow et al., 1988; English et al. 1989; Kora et al., 2005; Weiss et al., 1980b).
Under field conditions, peanut crops are commonly exposed to multiple biotic and abiotic stresses that may lead to defoliation and subsequent microclimate changes. Defoliation from late leaf spot (LLS), caused by Nothopassalora personata (Berk. & M. A. Curtis) U. Braun, C. Nakash., Videira & Crous, is one such biological stress. In South Carolina, LLS is the most prevalent and consistent cause of economic loss among fungal foliar diseases (Anco 2019). Late leaf spot causes necrotic lesions on leaves and stems that result in premature leaf defoliation (Nutter Jr and Littrell 1996). In the southeastern U.S., favorable environmental conditions for LLS development are common during the growing season (Alderman and Nutter Jr 1994), and continuing LLS development can result in total defoliation of plants in the absence of effective fungicides.
Artificial canopy modifications in peanut have been reported to influence development of diseases such as Sclerotinia blight (Bailey and Brune 1997; Dow et al., 1988) and southern stem rot (SSR) (Backman et al., 1975). Sclerotinia blight, caused by Sclerotinia minor Jagger, and SSR, caused by Athelia rolfsii (Curzi) Tu & Kimbrough (synonym: Sclerotium rolfsii Sacc.), are both economically important peanut diseases in the U.S., with SSR being the more common of the two in SC (Anco 2019; Backman et al., 1975; Bowen 2003; Grichar 1995; Shew and Beute 1984; Sturgeon Jr. 1986).
Earlier studies on the relationship between LLS and SSR have examined the effect of peanut residues on the development of SSR, in which defoliated peanut leaves may serve as a stimulant or food base for A. rolfsii development (Beute and Rodriguez-Kabana 1979a; 1979b). Volatile compounds generated by dried peanut residue have been reported to enhance germination of A. rolfsii sclerotia (Beute and Rodriguez-Kabana 1979a; 1979b). Results from these studies support the idea that preventing defoliation might reduce SSR development. However, contradictory results from several field studies reported increases in SSR intensity from fields with treatments to control leaf spot defoliation compared to fields without leaf spot management (Backman et al., 1975; Shew and Beute 1984). These results suggested that the role of a food base (e.g., defoliated peanut leaves) was less influential in the development of SSR when compared to other factors (e.g., atmosphere humidity and initial inoculum level).
Backman et al. (1975) observed a reduction of damage by A. rolfsii on plants with more open canopies as a result of clipping vertical branches. Likewise, Shew and Beute (1984) observed high infection of A. rolfsii on plants with relatively dense canopy as a result of treatments that inhibited leaf spot defoliation. In both studies, while differences in environmental parameters of canopy microclimates were not measured, an intact canopy was considered to be more conducive for the development of increased A. rolfsii infections compared to an open canopy (Backman et al., 1975; Shew and Beute 1984).
Among the available literature, studies to date have not been reported to evaluate differences in plant microclimates as a function of LLS defoliation and how these differences may affect SSR incidence. The current study’s objectives were 1) to investigate the effect of LLS defoliation on plant microclimate environmental parameters (canopy temperature, soil temperature, and soil moisture); and 2) to evaluate the relationship of LLS defoliation and SSR development.
Materials and Methods
Experimental site, design, and establishment of plots
Experimental site
Experiments were conducted in 2016, 2017, 2018, and 2019 at Clemson University’s Edisto Research and Education Center in Blackville, SC. In 2016, the study was conducted in three fields: D13A; B5A; and B9A. In 2017, the study was performed in two fields: D13A and L1C. In 2018, D13A and L1D fields were used for the experiment. L1C and L1D fields were two different fields located next to each other. In 2019, only D13A was used for the study. Soil type in examined fields was a Barnwell loamy sand. D13A and B5A were not irrigated, while B9A, L1C, and L1D were irrigated. Irrigation was performed using a Reinke lateral move irrigation system (Reinke Manufacturing Co., Inc., Deshler, NE, USA) scheduled for 19 mm irrigation per two weeks. If <19 mm rainfall occurred within the two-week period, supplemental irrigation was used to reach a total equivalent of 19 mm.
Experimental design
To encourage different levels of LLS development, three fungicide spray programs were applied over four peanut cultivars according to a split plot experimental design. Spray program (main plot) consisted of three different frequencies of chlorothalonil (Bravo WeatherStik; Adama USA; Fungicide Resistance Action Committee [FRAC] M5) applied at 1.26 kg active ingredient (a.i.)/ha: (i) 3 sprays at 75, 90, and 105 days after planting [DAP]; (ii) 4 sprays at 60, 75, 90, and 105 DAP; and (iii) 6 sprays at 45, 60, 75, 90, 105, and 120 DAP. Four runner market type peanut cultivars (sub plot) were selected for varying relative susceptibility to LLS and SSR: (i) Georgia 12Y (resistant to LLS and SSR); (ii) Georgia 06G (moderately resistant to LLS and susceptible to SSR); (iii) TUFRunner 511 (very susceptible to LLS and moderately resistant to SSR); and (iv) Georgia 13M (very susceptible to LLS and susceptible to SSR) (Anco and Thomas 2019). Twelve treatments (combinations of sprays and cultivars) were replicated four times per field, with the exception of D13A in 2016 where treatments were replicated 6 times. Blocks were separated by a 3-m wide alley.
Establishment of plots
In 2016, peanut was planted in B5A, D13A, and B9A on 21 April, 27 April, and 16 May, respectively. In 2017, planting dates were 4 May in D13A and 18 May in L1C. In 2018, peanut was planted in D13A and L1D on 1 May and 1 June, respectively. Peanut was planted in D13A in 2019 on 13 May. Seeding rate was 19 seed/m at a depth of 5 cm. Sub plots were four 96-cm spaced rows by 12-m in length. The four rows were further separated into two yield rows and two traffic rows.
Yield rows of each sub plot were inoculated with A. rolfsii inoculum prepared using the method modified from Shokes et al. (1996). Modification was made on the media/carrier for A. rolfsii, in which instead of using oat only, a mix of corn + oat was used with 75% and 25% proportion (w/w) of corn and oat, respectively. Field inoculation with lab-prepared corn + oat inoculum was performed between 30 to 45 DAP by scattering 20 g inoculum along each yield row.
Fungicide treatments and agrochemical maintenance applications were applied parallel to sub plots while driving over adjacent traffic rows of contiguous plots whereas yield rows were used for data collection and were not defiled by tire travel. Fungicide applications were performed with two DG8002 flat fan nozzles/row (48.26 cm spacing) delivering 142.5 L/ha at 345 kPa. Line between the two traffic rows were traveled and the adjacent two yield rows were sprayed.
Assessment of disease
Percent LLS leaflet defoliation per plot was visually estimated from 6 subsamples of non-overlapping 0.3-m sections of the 2 yield rows, excluding plot ends. In 2016, defoliation was rated prior to inversion. Defoliation ratings in 2017, 2018 and 2019 were taken at biweekly interval starting from 75 DAP to 140 DAP in each sub-plot. Area under LLS defoliation curve (AUDC) from 2017 to 2019 experiments was calculated using the following formula:
Southern stem rot incidence per plot was evaluated at inversion. Incidence was quantified by summing non-overlapping discrete 0.3-m sections of windrow (an inverted peanut row from two yield rows in each sub-plot) expressing symptoms of SSR or showing signs of A. rolfsii and converted to a proportion by dividing by the total two-row length (24 m).
Assessment of plant microclimate
Canopy and soil temperature were monitored in 15 min intervals using RC-5 USB temperature data loggers (Elitech Technology, Inc., Milpitas, CA, USA) starting from 3 to 11 weeks after planting to the day of peanut inversion during the 2016 through 2019 growing seasons. Data loggers were placed under the canopy and secured on the surface of the ground using wires. Soil temperature was monitored with loggers buried in the pegging zone at a depth of 7 to 10 cm. In 2016, 2017, and 2018, canopy and soil temperature data loggers were placed at one of the yield rows of each sub-plot in one set of treatment replication (12 treatments, 1 replication) per field. Therefore, each field had the total of 24 data loggers: 12 for canopy temperature and 12 for soil temperature. Temperature data (microclimate) were combined (pooled) from multiple fields within a trial year, and when treatments were compared, field functioned as a level of replication and was included as a random effect in the model. In 2019, canopy and soil temperature data loggers were placed in two sets of treatment replications in the field as there was only one trial field. The 2019 field had the total of 48 data loggers where 24 data loggers recorded canopy temperature and another 24 data loggers recorded soil temperature.
Cumulative canopy degree days from when temperature data loggers were placed in the fields (8 Jun 2017 and 29 Jun 2018) to 140 DAP (selected to match with LLS defoliation observation days) in each treatment was calculated by the formula:


Where Y(t) is canopy temperature at time t, t is time, alpha is canopy maximum temperature, beta is canopy temperature at t0 (initial canopy temperature or canopy minimum temperature), gamma is the rate of temperature shift (the slope of temperature increase), D is the random effect of date, and ε is experimental error. The slopes of canopy temperature curve (gamma) from the fitted model were regressed against AUDC of each treatment to evaluate the relationship between AUDC and the rate of temperature change within plant canopy.
Soil moisture was monitored and recorded using soil moisture sensors S-Smx-M005 and HOBO data loggers (ONSET Computer Corporation, Bourne, MA, USA) in the 2017 and 2018 experiments. In 2019, soil moisture was monitored using WATERMARK sensors and Soil Moisture Meters (IRROMETER Company Inc., Riverside, CA, USA). Soil moisture or watermark sensors were placed in the pegging zone at a depth of 7 to 10 cm. In 2017 and 2018, soil moisture sensors (probes) were placed at one of the yield rows of each sub-plot (the same row and sub-plot where temperature data loggers were placed) in one replication of treatments per field. Each field in 2017 and 2018 had the total of 12 soil moisture sensors (probes). With this setup, when soil moisture data (microclimate) were combined (pooled) from multiple fields within a trial year, and when treatments were to compare, then field functioned as a level of replication and was included as a random effect in the model. On the other hand, in 2019 where the experiment was performed in one field, watermark sensors were placed in two sets of treatment replications (12 treatments, 2 replications). Therefore, the 2019 trial field had the total of 24 watermark sensors in the field.
Cumulative daily soil moisture loss between two rainfall events at early season (75 to 89 DAP) and when LLS defoliation was significant (103 to 117 DAP) were calculated and compared across treatments. Soil moisture loss between two rainfall events at both early- and mid-season were calculated only in the periods when no irrigation was applied in between the two rainfall events.
Data analysis
The GLIMMIX procedure of SAS was used to analyze treatment effects for LLS defoliation, AUDC, SSR severity, daily maximum canopy and soil temperature, cumulative canopy and soil degree day (DD15), cumulative daily soil moisture loss, and yield according to generalized linear mixed modeling. Laplace approximation was used to improve standard error estimation (Pinheiro and Chao 2006; Stroup 2013). Factors considered fixed effects included LLS spray program, cultivar, and corresponding interactions. Random effects included replication (individual field-year models) or replication by field by year + field by year + year (model over multiple fields and years). Where random effects were estimated to be zero or did not improve fit of the model, they were excluded. In general, responses were modeled according to the Gaussian distribution. Fisher’s protected least significant difference (LSD) was used for pairwise comparisons at α = 0.05.
To evaluate the influence of LLS defoliation on canopy and soil temperature, LLS defoliation was linearly regressed against daily maximum canopy and soil temperature at each observed DAP in each trial year. Regression was also performed over the pooled data including year as a random effect. To investigate if LLS defoliation was influential to the rate of temperature change within plant canopy, AUDC were regressed against the slope of fitted canopy temperature curves. Relationship of LLS defoliation and cumulative canopy degree day (DD15) was assessed with linear regression using AUDC and DD15 data. The influence of LLS defoliation on soil moisture loss between two rain events was investigated by regressing AUDC differences between early and mid-season against soil moisture loss differences during the same time. Lastly, linear regression analyses using AUDC and percent SSR data from each trial year (with field and replication within the field as random effects) as well as using combined year AUDC and percent SSR data (with year, field within year, and replication within field within year as random effects) were performed to evaluate the relationship between LLS and SSR.
Results and Discussion
Effect of treatment on LLS defoliation
Establishment of varying LLS defoliation in peanut has been frequently achieved with application of fungicides that either differed in individual efficacy (Backman and Crawford 1984) or application schedule (Nutter Jr and Littrell 1996). In the present study, treatments with varying number of fungicide applications and cultivar susceptibility similarly generated different levels of LLS defoliation in experiments from 2016 to 2018 (Table 1). As applicable, differences in AUDC among treatments in the 2017 and 2018 experiments were provided in Table 2. No LLS defoliation was observed in the 2019 growing season, and the overall incidence of LLS was low (≤ 6% at 140 DAP) (data not shown). The minimal development of LLS in 2019 was associated with dry weather over the course of the growing season in Blackville, SC (Anco et al. 2020). In 2019, rainfall during the growing season (May to October) totaled 476 mm which was relatively lower compared to 771, 572, and 859 mm in 2016, 2017, and 2018, respectively. In addition, average air temperature in the 2019 growing season (May to October) was relatively higher compared to average air temperatures in the 2016, 2017, and 2018 growing seasons (25°C in the 2019 growing season vs 24.4, 23.6, and 24.4°C in the 2016, 2017, and 2018 growing seasons, respectively). Despite no LLS defoliation in the trial field, foliar damage and defoliation due to velvetbean caterpillar (VBC) were observed in the 2019 trial near the end of the growing season from 5 to 30% defoliation at 120 DAP (data not shown).
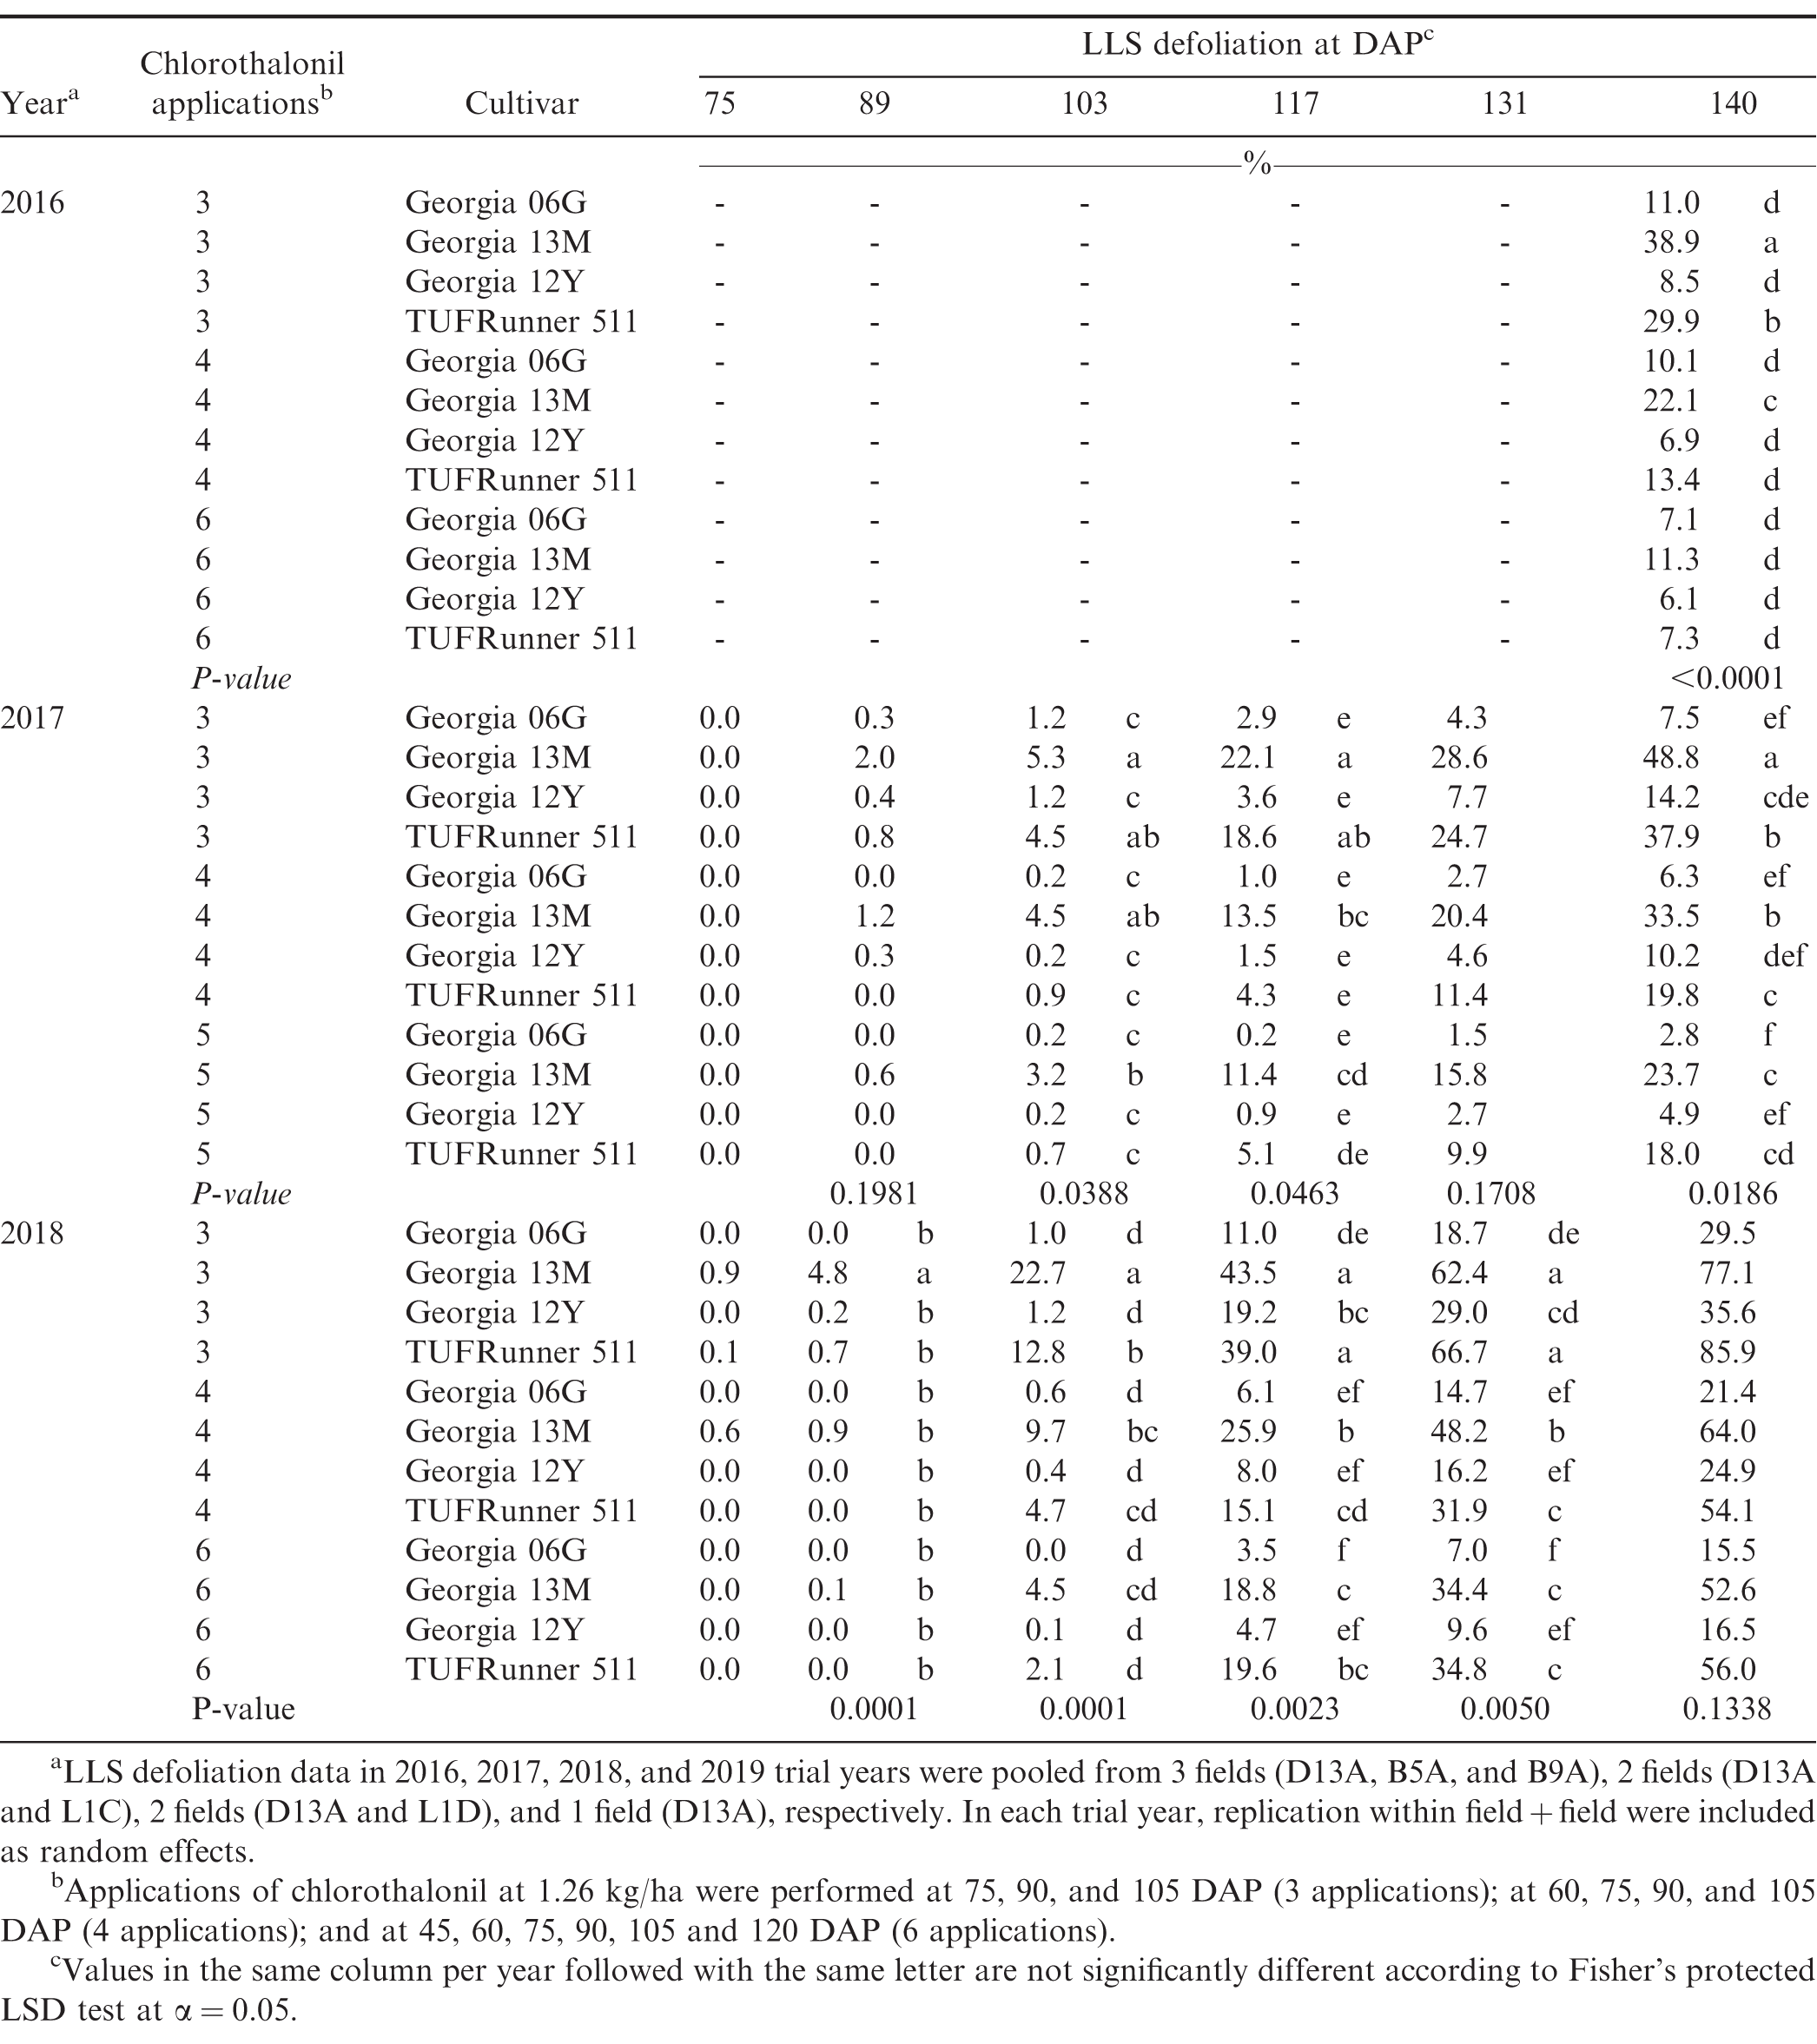
Late leaf spot (LLS) defoliation at days after planting (DAP) as affected by number of chlorothalonil applications and peanut cultivar in 2016, 2017, and 2018.
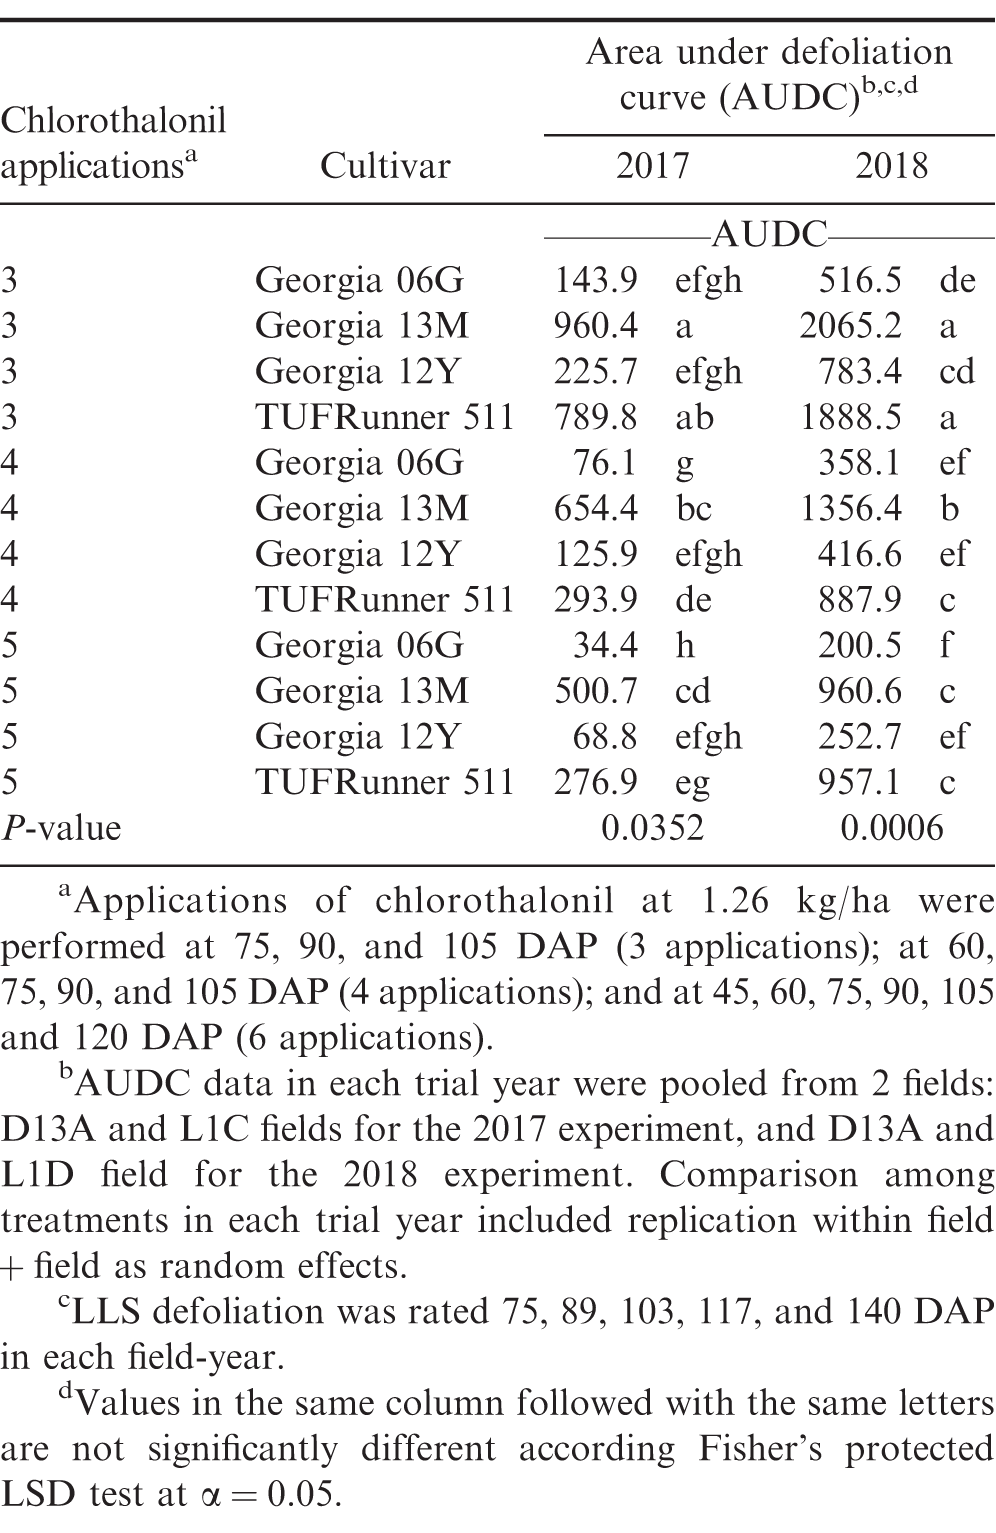
Estimated area under late leaf spot (LLS) defoliation curve (AUDC) as affected by treatment in 2017 and 2018.
Relationship between LLS defoliation and maximum canopy & soil temperatures
Significant positive linear relationships between LLS defoliation and daily maximum canopy temperature were observed in both 2017 (P = <0.0001 and R2 = 0.223) and 2018 (P = <0.0001 and R2 = 0.294) (data not shown). A slightly stronger relationship was associated with the combined data from 2017 and 2018 (P = <0.0001 and R2 = 0.305) (Figure 1). While these results suggest LLS defoliation can influence plant canopy temperature, the R2 values indicate that this only accounted for up to approximately 30% of variation.
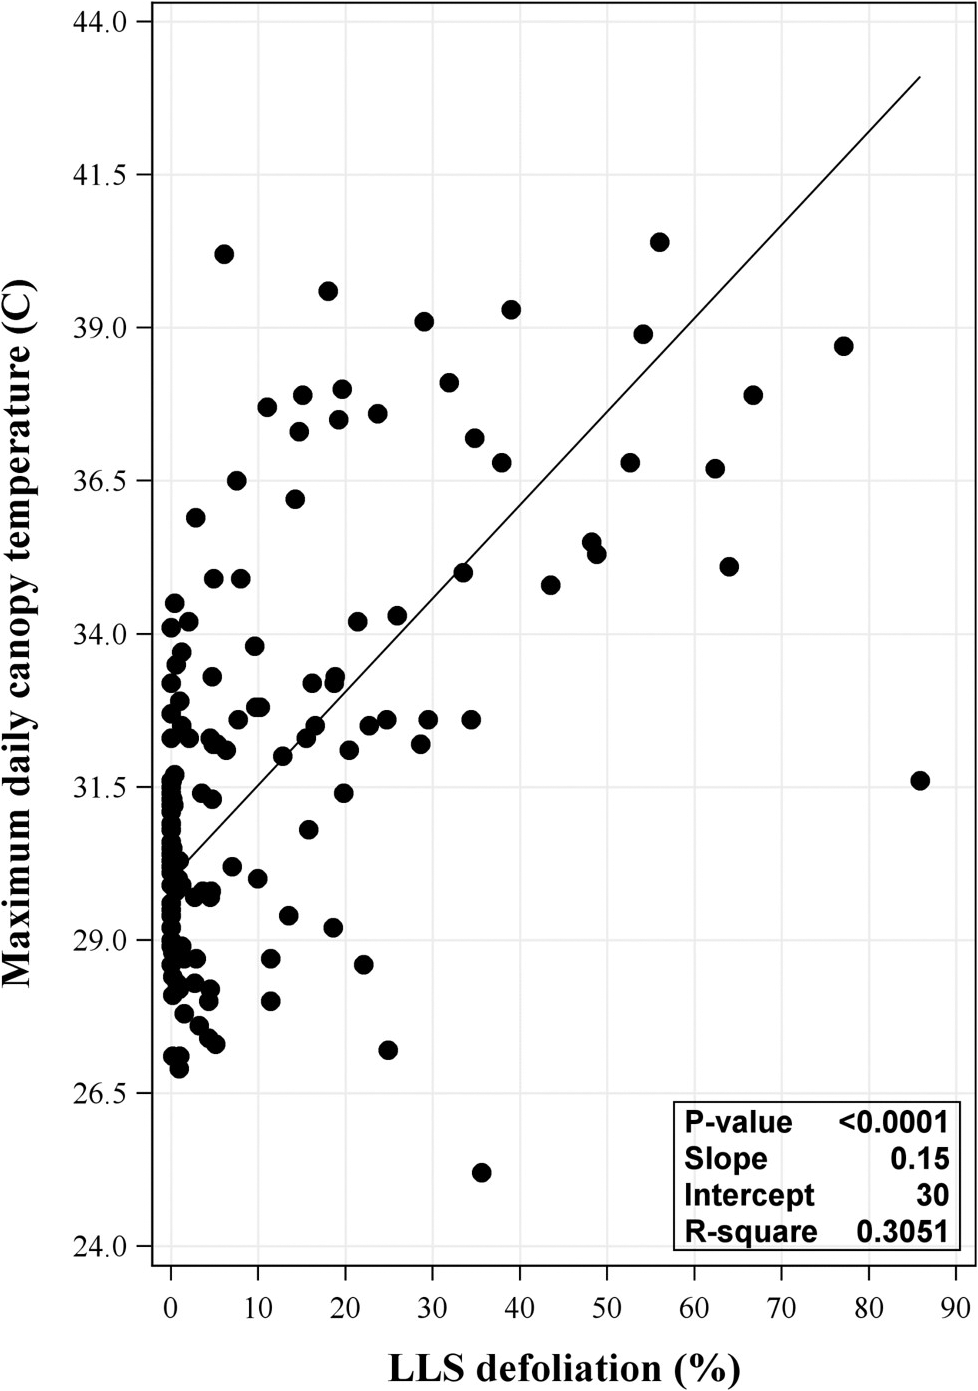
Relationship between maximum daily canopy temperature and late leaf spot (LLS) defoliation at each observed day after planting (DAP) from the 2017 and 2018 combined data. Defoliation was observed at 75, 89, 103, 117, 131, and 140 DAP in each field per year. Regression analysis included year as random effect. P-value shown in the inset of each panel was the same for the model and slope.
With regards to maximum daily soil temperature, relationships with LLS defoliation were weaker overall (Figure 2). The direction of the relationship was furthermore inconsistent between years, having been positive and negative in 2017 and 2018, respectively (Figure 2A and 2B). The relationship was not significant over the combined data (P=0.9809) (data not shown). Accordingly, levels of LLS defoliation in this study were neither consistently nor substantially influential with regards to soil temperature.
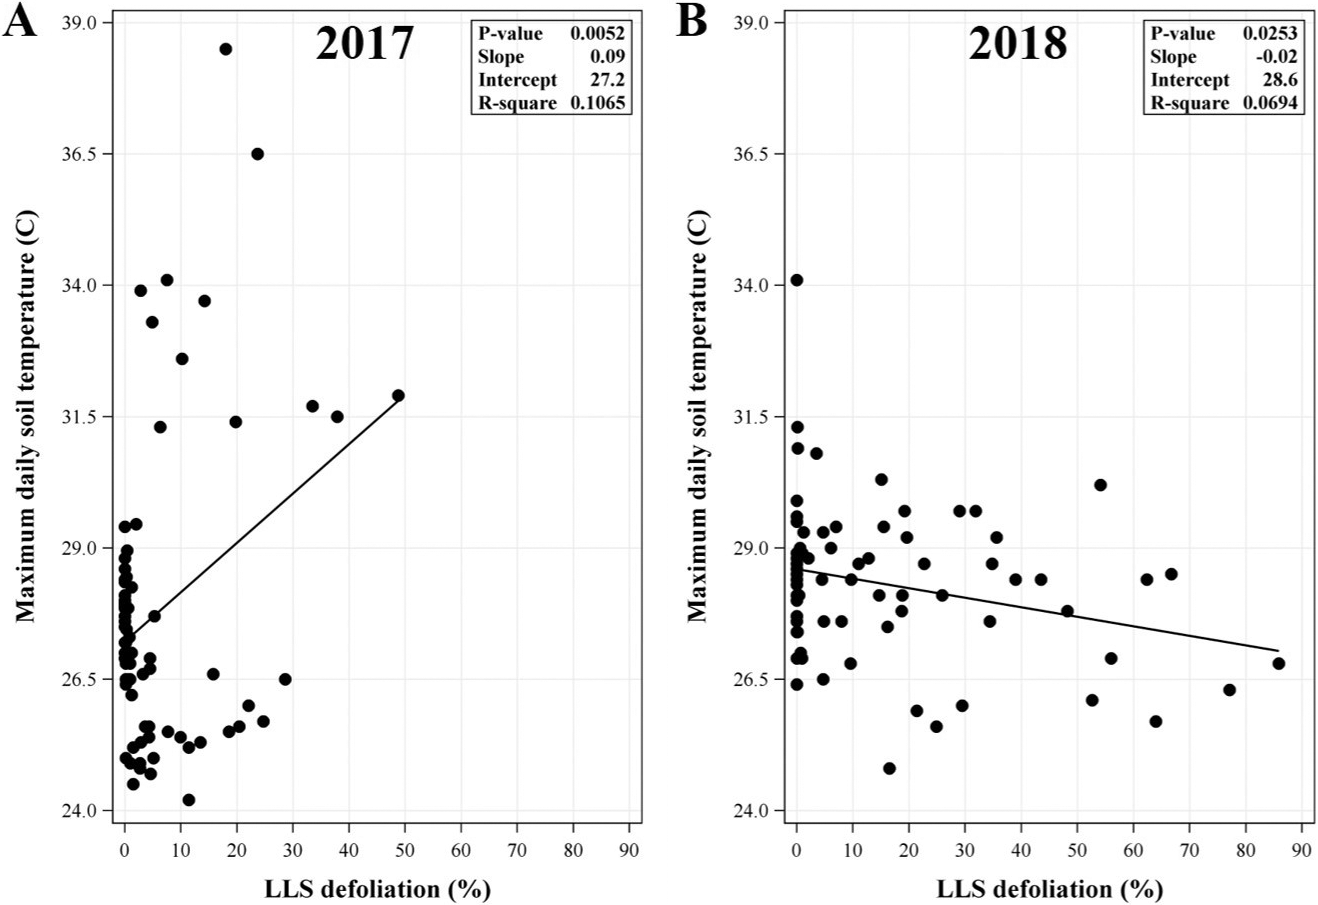
Relationship between maximum daily soil temperature and late leaf spot (LLS) defoliation at each observed day after planting (DAP) from the (A) 2017 and (B) 2018 data. LLS defoliation was observed at 75, 89, 103, 117, 131, and 140 DAP in each field per year. Regression analysis included replication (year) as random effect. P-value shown in the inset of each panel was the same for the model and slope.
Relationship between LLS defoliation and rate of canopy temperature shift and DD15 accumulation
Linear regression analyses on AUDC (defoliation progress from 75 to 140 DAP) and the slopes of daily canopy temperature increase from minimum to maximum during the same time showed a non-significant and significant positive linear relationships in 2017 and 2018, respectively (Figure 3). This difference may be associated with the level of disease pressure in each trial year. In this study, overall magnitude of LLS defoliation in 2018 was greater than in 2017 (AUDC ranged from 200 to 2000 in 2018 vs 34 to 900 in 2017). While the level of LLS defoliation in 2018 may be sufficient to significantly influence the rate of temperature shift within the canopy, the magnitude of LLS defoliation in 2017 may be insufficient to influence the temperature shift within canopy. A significant positive linear relationship in 2018 suggests that the higher the AUDC, the faster the rate of temperature increase within the canopy from minimum to maximum. A less defoliated canopy may provide a more isolated system (although it is not a completely closed system) that slows air movement through the canopy in relation to changes in ambient temperature. More defoliation may increase air movement and allow temperature to more rapidly adjust to changing ambient conditions. Other factors not evaluated in this study such as canopy characteristic of each cultivar (e.g., branching, growth rate, shape) may also create a more open or closed system and in turn may offset concurrent defoliation. Yuan et al. (2019) reported significant differences in canopy size (height and width), shape and density (e.g., open, dense, and round canopies) among three runner market type peanut cultivars (Georgia-04S, McCloud, and Southwest Runner) using light detection and ranging sensors (LiDAR) scans. When a canopy is a relatively closed system (e.g. a canopy with a much more overlapping leaves or a dense canopy), the overlapping leaves blocked the LiDAR signal from penetrating the canopy resulting in a cluster of leaf image in the image file. On the other hand, if the canopy architecture was more sparse or open, some LiDAR signals can pass through leaves and bounce back to the LiDAR. In the image file, these openings appear as holes (Yuan et al., 2019). Put another way, a denser canopy has fewer holes in the image file (Yuan et al., 2019). Using this method, Yuan et al. (2019) found that Georgia-04S had a relatively denser and more rounded canopy compared to Southwest Runner (Southwest Runner had the most open canopy) in later growth stages. In our study, canopy shapes among cultivars of Georgia-06G, Georgia-13M, and Georgia-12Y were difficult to be visually differentiated (or in other words they appeared relatively similar). However, TUFRunner 511 canopy appeared to be more open relative to the previously mentioned group of cultivars (Georgia-06G, Georgia-13M, and Georgia-12Y). TUFRunner 511 has a prostrate growth habit and a prominent center stem which tends to fall to either side of the center after about 100 to 120 DAP (Tillman and Gorbet, 2017). This canopy characteristic may be associated with a more open canopy of TUFRunner 511. Georgia-06G, Georgia-12Y, and Georgia-13M, on the other hand, have an intermediate runner decumbent growth habit (Branch, 2007). Moreover, a cultivar such as Georgia-12Y has been frequently reported to have rapid canopy closure compared to other Runner type peanuts (Jordan et al., 2017; Jordan et al., 2019; Plumbee et al., 2018). Taking this into account, while Georgia-13M had greater LLS defoliation and/or AUDC than TUFRunner 511 in some instances observed in our study, the nature of TUFRunner 511 canopy may still have created a more open system compared to Georgia-13M and in turn may have offset the effect of LLS defoliation on microclimate conditions.
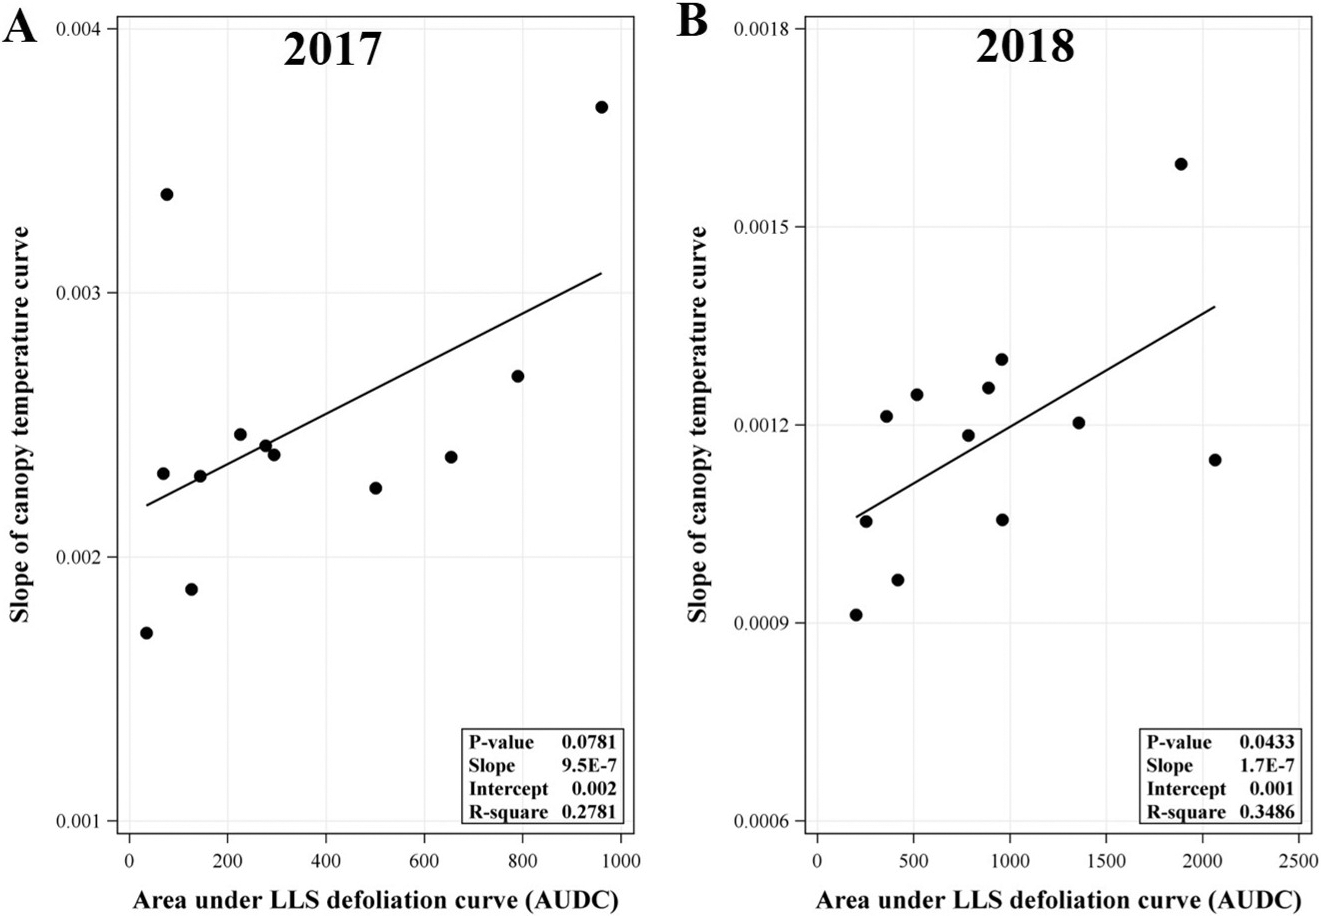
Relationship between slope of logistic model fitted-canopy temperature curve (daily increase from minimum to maximum) from 75 to 140 days after planting and area under late leaf spot (LLS) defoliation curve (AUDC) in the (A) 2017 and (B) 2018 experiments. P-value shown in the inset of each panel was P-value for the slope. Daily canopy temperature curves were fitted to following the logistic response equation: Y(t) = (alpha/(1 + beta*exp(-gamma*t))) + D + ε, where Y(t) is canopy temperature at time t, t is time, alpha is canopy maximum temperature, beta is canopy temperature at t0 (initial canopy temperature or canopy minimum temperature), gamma is the rate of temperature shift (the slope of temperature increase), D is the random effect of date, and ε is experimental error. AUDC data in each trail year were pooled from two fields: D13A and L1C fields for the 2017 experiment, and D13A and L1D field for the 2018 experiment.
Regression analysis showed non-significant linear relationships between AUDC and DD15 in 2017 and 2018 with P-values 0.2660 and 0.6141, respectively (data not shown). These consistent results across years suggests that LLS defoliation in the experiments did not substantially influence accumulated heat units within the canopy.
Relationship between LLS defoliation and soil moisture loss between two periods of rainfall
Following excessive sensor and logger failings in 2018 to record soil moisture data and the absence of LLS defoliation in 2019, investigation on the relationship between LLS defoliation and daily soil moisture loss was only conducted for the 2017 data. Soil moisture loss at both early- and mid-season were calculated in the periods between two rainfall events and only when no irrigation was applied within the duration between the two events. Soil moisture data within the periods between 24 July 2017 to 2 August 2017 (75 to 89 DAP) and between 9 to 24 August 2017 (103 to 117 DAP) were used to calculate soil moisture loss at early- and mid-season, respectively. Cumulative daily soil moisture loss between periods of rainfall at early- (75 to 89 DAP) and mid-season (103 to 117 DAP) when AUDC ranged from 0 to 14 and 2 to 161, respectively, did not differ among treatments (Table 3). There was not a significant linear relationship between AUDC difference and the difference of cumulative soil moisture loss at early- and mid-seasons (P = 0.1989) (data not shown). Soil moisture loss was thus unrelated to AUDC from the available data in this study. While soil moisture was reported to influence growth of A. rolfsii (Mustafee and Chattopadhgay 1971; Ramarao and Raja 1980; Shew et al. 1984; Weerapat 1964), results from this study suggest AUDC does not directly substantially affect this microclimate component.
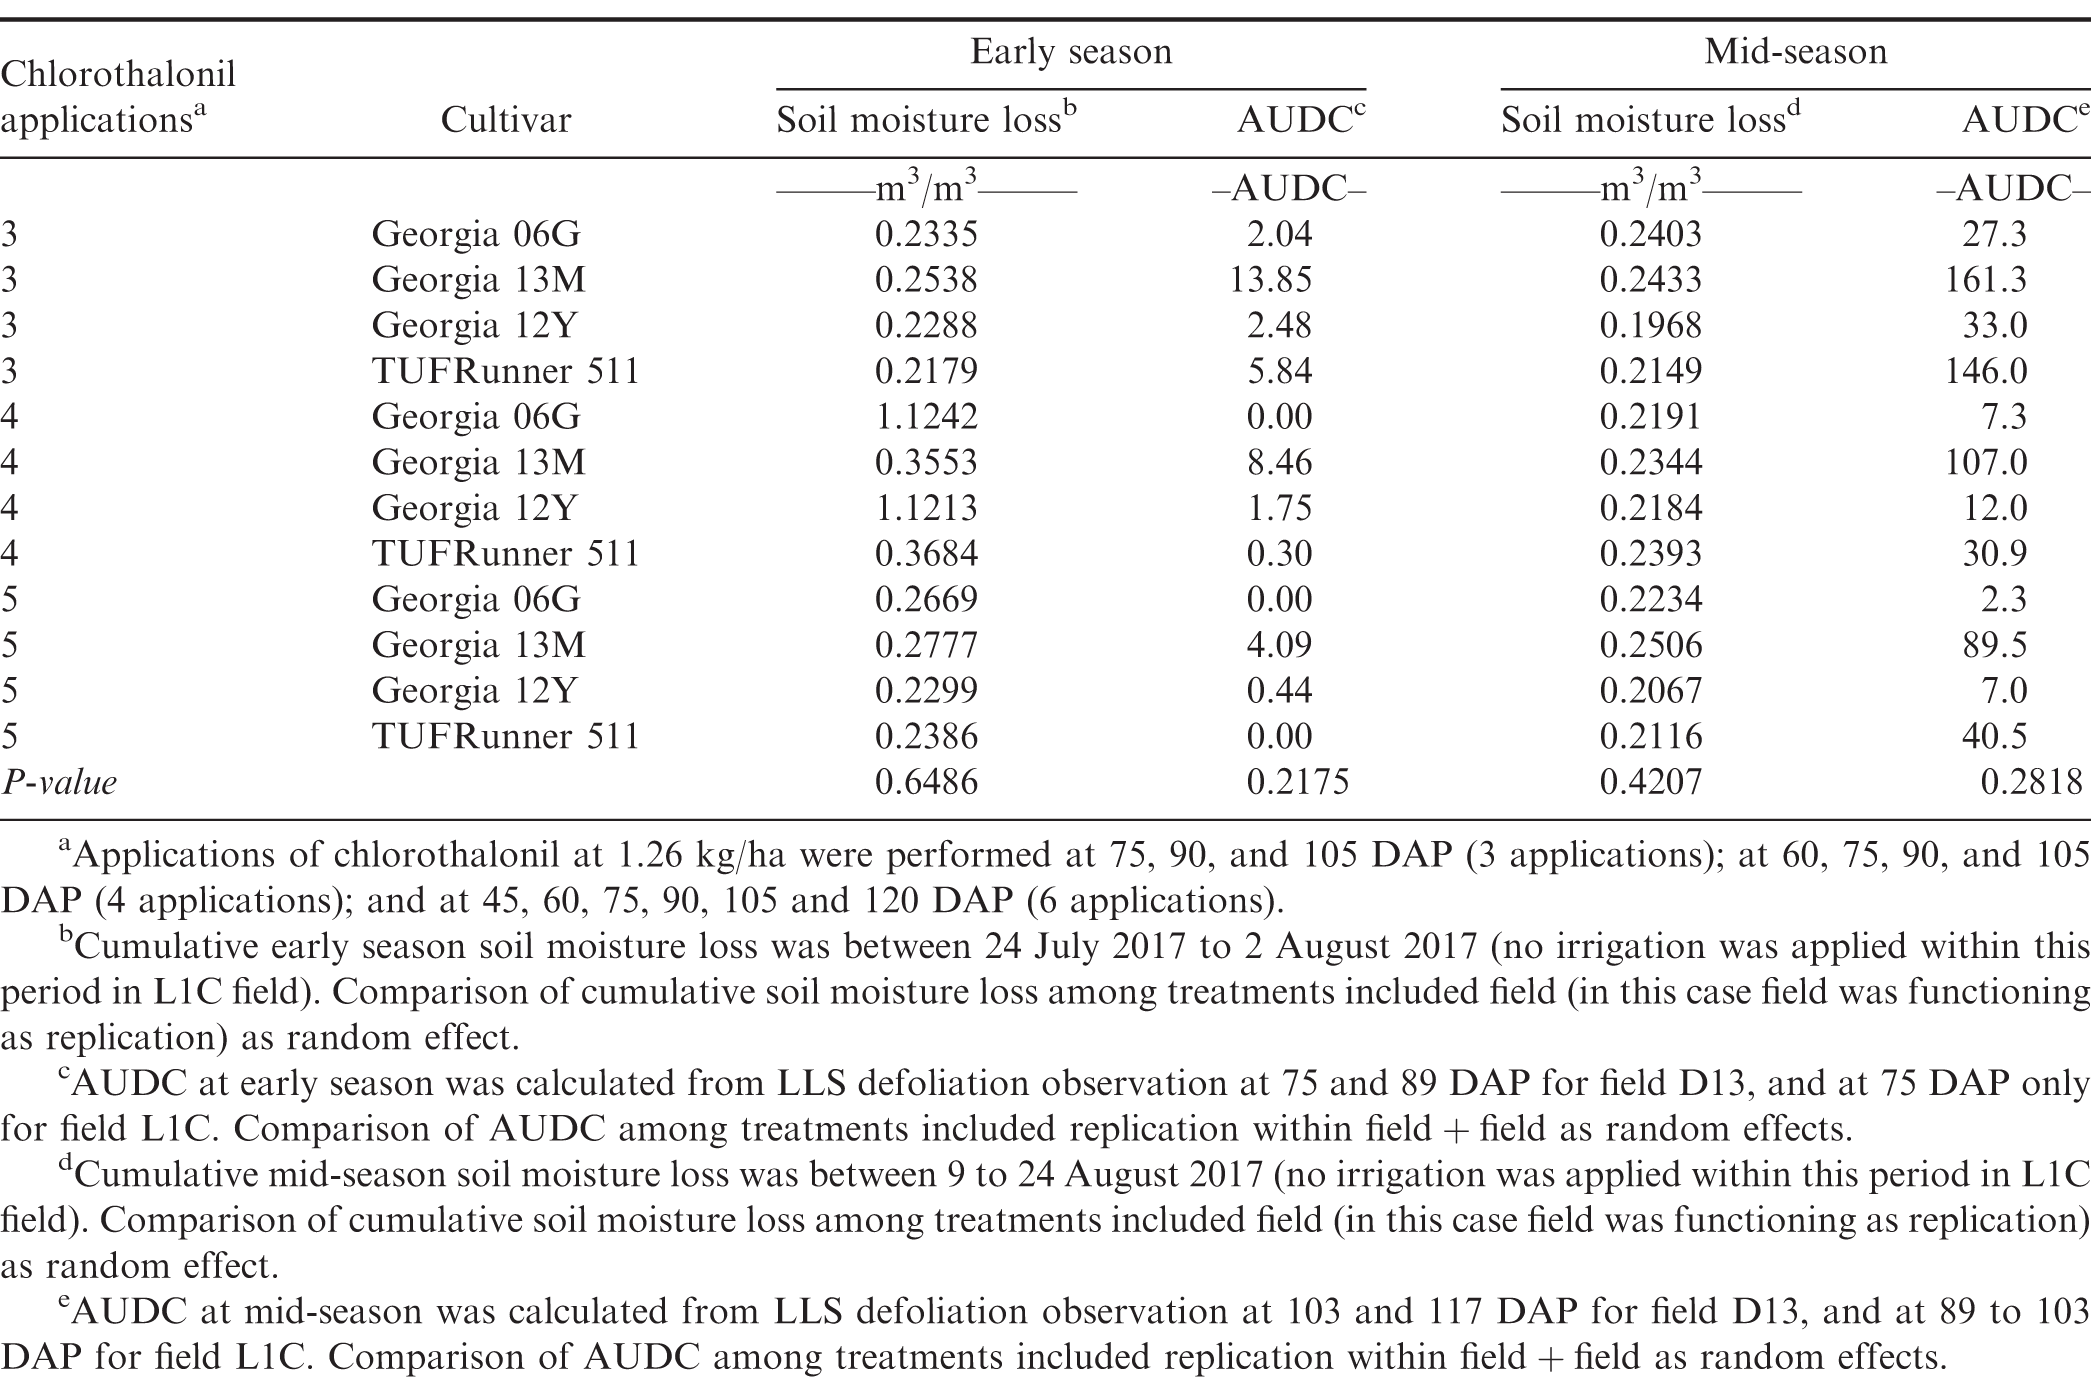
Cumulative daily soil moisture loss between two rainfall events at early season and mid-season and the corresponding area under late leaf spot defoliation curve (AUDC) as affected by spray program and peanut cultivar in 2017.
Relationship between LLS and SSR
Non-significant linear relationships between AUDC and SSR were observed from the regression with the combined data from 2017 and 2018 (P = 0.0800) (Figure 4). Likewise, regression analysis using data from individual year revealed non-significant relationship of the two factors (P = 0.1577 and 0.1973, for 2017 and 2018, respectively) (data not shown) This corroborates results from Backman et al. (1975) in which defoliation and peanut leaf spot infection were reported to be unrelated to A. rolfsii damage. No relationship between LLS and SSR infection in this study could indicate that plant microclimate changes due to LLS were at a level insufficient to substantially affect SSR. An extensive review on factors affecting the development of A. rolfsii in the lab and fields was previously conducted by Punja (1985). Among many factors, level of A. rolfsii inoculum has been reported to be important in its development in the field (Boote 1982; Punja 1985; Shew and Beute 1984; Shew et al., 1984). Even though effort to inoculate experimental plots with lab-prepared A. rolfsii inoculum was performed, the ability of the inoculum to incite SSR in the field can vary and depend on many factors such as virulence of the inoculum, presence of antagonists (contamination with other fungi and/or bacteria), application method, and environmental conditions (e.g. sunlight exposure) (Shokes et al., 1996). While aforementioned factors influencing lab-prepared inoculum in infecting peanut in the field were not examined in this study, there was a likelihood for lab-prepared inoculum to fail in establishing disease in the field or in some part of the field and that SSR disease pressure may stem, in most parts, from natural inoculum instead. This may explain the condition where SSR pressure was low in some fields. Collectively, these factors along with insufficient changes in plant microclimates due to LLS defoliation, may contribute to the lack of relationship of LLS and SSR in the field.
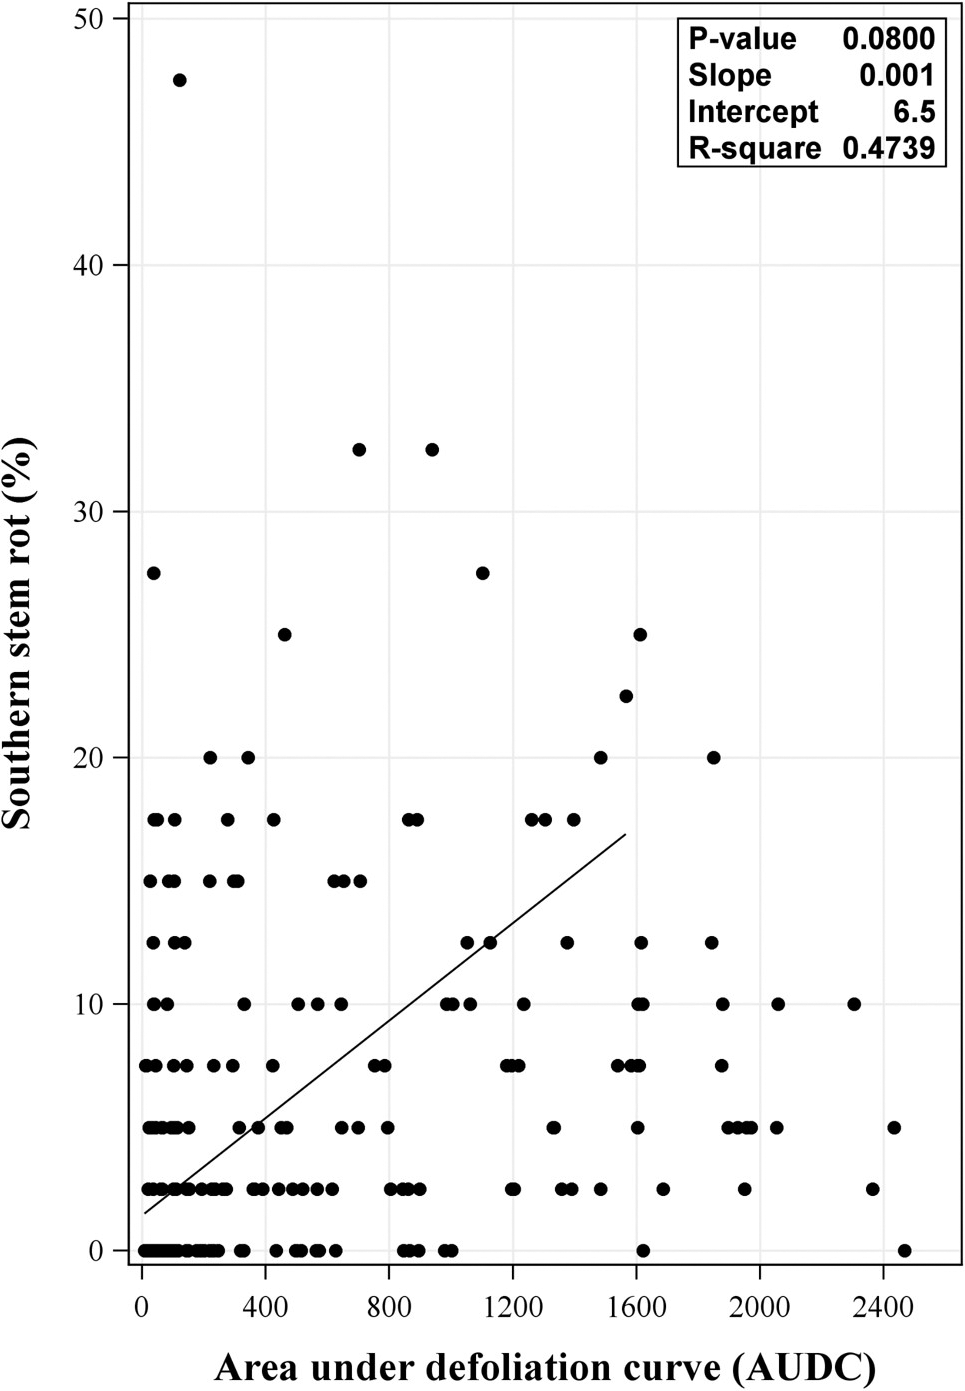
Relationship between area under late leaf spot (LLS) defoliation curve (AUDC) and southern stem rot incidence from the 2017 and 2018 combined data. Regression analysis included replication within field within year + field within year + year as random effects. P-value shown in the inset of each panel was P-value for the slope.
In conclusion, while LLS defoliation may to a slight degree appear to affect canopy maximum daily temperature and the rate of temperature shift within the canopy, its inconsistent effect on observed microclimate components across years indicates that its overall impact (direct or indirect) on SSR development was minimal. Canopy structure is dynamic throughout the growing season as the population of leaves and stems generally will increase. While plant (re-)growth was not simultaneously measured along with LLS development in this study, LLS defoliation data over time suggest that percent of leaves in each cultivar continue to decrease along with the increase percent of LLS defoliation toward the end of cropping season. This indicates that newly formed leaves (re-growth) on each cultivar may be insufficient to offset LLS defoliation and therefore, it may not be a substantial factor diminishing the influence of LLS defoliation on plant microclimates. However, differences in canopy characteristic (e.g. open and close) among Runner type peanuts, as reported in another study (Yuan et al., 2019) and observed in the trial fields between TUFRunner 511 and other Georgia cultivars, may influence the amount of air permeability of a given canopy, and in turn it may potentially contribute to the lack of a substantial effect of LLS defoliation on plant microclimate or SSR development.
Humidity within plant canopy has been thought as one important factor affecting SSR development (Backman et al., 1975). Like canopy temperature, relative humidity within canopy can also be affected by canopy characteristic and plant density (Sconyers et al. 2005). Sconyers et al. (2005) observed significant differences in canopy temperature and relative humidity among treatments with two peanut cultivars varying in canopy characteristic (growth type upright vs prostate) and four different plant spacings (plant spacings ranged from 5.1- to 30.5-cm). However, they also reported that the difference of canopy microclimates (temperature and relative humidity) among treatments was inconsistent and did not explain difference in SSR among spacings (Sconyers et al. 2005). While not evaluated in the current study, it is likely that LLS defoliation and the variation in canopy characteristics among cultivars may have influenced relative humidity within the canopy and in turn may have affected SSR. Future studies should include canopy humidity as one of the evaluated microclimate components to further understand relationship between LLS and SSR through a mechanism of microclimate modification. From a disease management perspective, an overall lack of an interaction between LLS and SSR benefits growers in the sense that it simplifies disease management. If our management of LLS defoliation substantially changed the subsequent risk to SSR incidence, SSR management might need to take our LLS management efficacy into account. The absence of such a relationship allows management of the two diseases to be approached more independently, which adds a degree of flexibility. Regardless, the lack of a relationship between LLS and SSR development further corroborates the importance of utilizing resistant cultivars.
Acknowledgements
Thanks to James Thomas, Justin Hiers, and Trevor Zorn for assistance in establishing and maintaining field plots. Support for this project was provided by the South Carolina Peanut Board. This material is based upon work supported by NIFA/USDA, under project number SC-1700532. Technical Contribution No. 6926 of the Clemson University Experiment Station.
Literature Cited
Alderman, S. C. and Nutter F. W. 1994. Effect of temperature and relative humidity on development of Cercosporidium personatum on peanut in Georgia. Plant Dis. 78: 690– 694.
Anco, D. J. 2019. Peanut disease management. Peanut Money-Maker 2019 Production Guide:42-53.
Anco, D. J., Hiers, J. B. Munir, M. and Thomas, J. S. 2020. Evaluation of Equus and Aproach Prima for control of late leaf spot and soil-borne diseases on ‘Sullivan’ peanut, 2019. Plant Dis. Manag. Rep. 14: 1– 2.
Backman, P., and Crawford. M. 1984. Relationship between yield loss and severity of early and late leafspot diseases of peanut. Phytopathology. 74: 1101– 1103.
Backman, P., Rodriguez-Kabana, R. and Williams. J. 1975. The effect of peanut leafspot fungicides on the nontarget pathogen, Sclerotium rolfsii. Phytopathology. 65: 773– 776.
Bailey, J., and Brune. P. 1997. Effect of crop pruning on Sclerotinia blight of peanut. Plant Dis. 81: 990– 995.
Beute, M., and Rodriguez-Kabana. R. 1979 a. Effect of wetting and the presence of peanut tissues on germination of sclerotia of Sclerotium rolfsii produced in soil. Phytopathology. 69: 869– 872.
Beute, M., and Rodriguez-Kabana. R. 1979 b. Effect of volatile compounds from remoistened plant tissues on growth and germination of sclerotia of Sclerotium rolfsii. Phytopathology. 69: 802– 805.
Blad, B., Steadman, J. and Weiss. A. 1978. Canopy structure and irrigation influence white mold disease and microclimate of dry edible beans. Phytopathology. 68: 1431– 1437.
Boote, K. 1982. Growth stages of peanut (Arachis hypogaea L.). Peanut Sci. 9: 35– 40.
Bowen, K. 2003. Development of stem rot (caused by Sclerotium rolfsii) in peanut in Alabama. Peanut Sci. 30: 120– 128.
Branch, W. D. 2007. Registration of ’Georgia-06G’ peanut. J. of Plant Regist. 1: 120.
Dow, R., Powell, N. and Porter. D. 1988. Effects of modification of the plant canopy environment on Sclerotinia blight of peanut. Peanut Sci. 15: 1– 5.
English, J., Thomas, C. Marois, J. and Gubler. W. 1989. Microclimates of grapevine canopies associated with leaf removal and control of Botrytis bunch rot. Phytopathology. 79: 395– 401.
Grichar, W. 1995. Management of stem rot of peanuts (Arachis hypogaea) caused by Sclerotium rolfsii with fungicides. Crop Prot. 14: 111– 115.
Jordan, B. S., Culbreath, A. K. Brenneman, T. B. Kemereit R. C.and Branch. W. 2017. Late leaf spot severity and yield of new peanut breeding lines and cultivars grown without fungicides. Plant Dis. 101: 1843– 1850.
Jordan, B. S., Culbreath, A. K. Brenneman, T. B. Kemereit R. C.and Stevenson. K. L. 2019. Effect of planting date and peanut cultivar on epidemics of late leaf spot in Georgia. Plant Dis. 103: 990– 995.
Kora, C., McDonald, M. R. and Boland. G. J. 2005. Lateral clipping of canopy influences the microclimate and development of apothecia of Sclerotinia sclerotiorum in carrots. Plant Dis. 89: 549– 557.
Mustafee, T. and Chattopadhgay. S. 1971. Effect of soil moisture on the growth of Macrophomina phaseoli, Sclerotium rolfsii and Fusarium solani in soil. Indian J. Microbiol. 11: 77– 82.
Nutter F. W.,and Littrell. R. H. 1996. Relationships between defoliation, canopy reflectance and pod yield in the peanut-late leafspot pathosystem. Crop Prot. 15: 135– 142.
Pinheiro, J. C. and Chao. E. C. 2006. Efficient laplacian and adaptive gaussian quadrature algorithms for multilevel generalized linear mixed models. J. of Comp. and Graph. Stat. 15: 58– 81.
Plumbee, M. T., Tubbs, R. S. Prostko, E. P. and Smith. N. B. 2018. Evaluation of seeding rate and cultivar effects on peanut (Arachis hypogaea L.) seeded in 76-cm row spacing. Peanut Sci. 45: 32– 37.
Punja, Z. K. 1985. The biology, ecology, and control of Sclerotium rolfsii. Annu. Rev. of Phytopathol. 23: 97– 127.
Ramarao, P. and Raja. U. 1980. Effect of soil moisture on development of foot and root rot of wheat and on other soil microflora. Indian J. of Myc. and Plant Pathol. 10: 17– 22.
Sconyers, L. E., Brenneman, T. B. and Stevenson. K. L. 2005. Effects of spacing, inoculation date, and peanut cultivar on epidemics of peanut stem rot and tomato spotted wilt. Plant Dis. 89: 969– 974.
Shew, B. and Beute. M. 1984. Effects of crop management on the epidemiology of southern stem rot of peanut. Phytopathology. 74: 530– 535.
Stroup, W. W. 2013. Generalized linear mixed models: modern concepts, methods and applications. CRC press.
Shokes, F. M., Róźalski, K. Gorbet, D. W. Brenneman, T. B. and Berger. D. A. 1996. Techniques for inoculation of peanut with Sclerotium rolfsii in the greenhouse and field. Peanut Sci. 23: 124– 128.
Sturgeon R. V. 1986. Peanut disease loss estimates for major peanut producing states in the United States for 1984 and 1985. Pages 24-26 in: The American Peanut Research and Education, Inc. The American Peanut Research and Education, Inc., Virginia Beach, VA.
Tillman, B. L., and Gorbet. D. W. 2017. Registration of ’TUFRunner ’511′’ peanut. J. of Plant Regist. 11: 235– 239.
Weerapat, P. 1964. Effect of soil temperature on resistance of rice to seedling blight caused by Sclerotium rolfsii Sacc. Texas A&M University.
Weiss, A., Kerr, E. and Steadman. J. 1980 a. Temperature and moisture influences on development of white mold disease (Sclerotinia sclerotiorum) on great northern beans. Plant Dis. 64: 757– 759.
Weiss, A., Hipps, L. Blad, B. and Steadman. J. 1980 b. Comparison of within-canopy microclimate and white mold disease (Sclerotinia sclerotiorum) development in dry edible beans as influenced by canopy structure and irrigation. Agri. Meteorol. 22: 11– 21.
Yuan, H., Bennett, R. S. Wang, N. and Chamberlin. K. D. 2019. Development of a peanut canopy measurement system using a ground-based LiDAR sensor. Frontiers in Plant Sci. 10.
Notes
- Edisto Research and Education Center, Clemson University, Blackville, SC 29817 [^] *Corresponding author Email: danco@clemson.edu
Author Affiliations