
Introduction
The indeterminate growth of peanut may create indecision on timing to dig for maximum maturity as well as economic value. Peanut producers and manufacturers recognize that digging too early or too late can reduce yield and grade as well as processing characteristics. Two results of digging early, aside from lower yields, are increased mass of immature peanuts entering storage facilities that may increase the risk of mold production (Aspergillus flavus), and immature peanuts which can cause off-flavor during roasting. Conversely, digging late may reduce yield by leaving pods on the soil surface (pod loss) caused by mechanical or biological damage to over-mature plants with diseased or weakened pegs due to age (Chapin and Thomas, 2005; Sorensen et al., 2015). Therefore, harvesting peanut at the optimum time would have greatest peanut yield, least peanut loss, and reduce the risk of mold growth in the warehouse and for the development of off flavors during roasting.
Since 1981, the current standard to determine peanut maturity and possible digging date is the hull scrape method and associated maturity profile board (Williams and Drexler, 1981). This process uses a pressure washer to remove the exocarp of the peanut hull to reveal a hull color (also called pod blasting). As peanuts mature, the hull color beneath the exocarp turns color starting at immature white, moving to yellow, orange, brown, and finally mature black. Peanut placement on a color board using hull scrape color is highly dependent on individual's observation as to which color profile each individual pod should be placed. Individuals may see hull color differently allowing for personal bias to select specific profiles compared to another individual. Moving pods from one maturity column to another, especially in the brown and black classes may give the grower a false positive or negative digging date. The result of a false maturity would be digging to early or to late with adverse consequences described above.
It has been proposed to use mechanical or electronic techniques to identify hull color to reduce human bias and ambiguity. Other techniques have been tried that range from chemical and mechanical manipulation of kernel or hulls to the estimation of peanut maturity using plant age, plant parts, meteorological data, or combination of these to estimate time to harvest or peanut maturity (Boldor et al., 2002; Chapin and Thomas, 2005; Colvin et al., 2014; Grimm et al., 1998; Rowland et al., 2006; Sanders et al., 1980; Sanders et al., 1982a; Sanders et al., 1982b; Sorensen et al., 2015).
Many of these techniques have proved useful with a fair degree of confidence; however, none have been more widely accepted than the hull scrape method. Most of the maturity techniques developed over the decades have focused on the peanut hull with few techniques looking expressly at the kernel. With the indeterminate growth habit of peanut, it would seem probable that the peanut hull may be mature, i.e. showing a black mesocarp color, but the kernel may be immature or non-existent (called pops), which would give a false positive of peanut maturity. However, the comparison of hull color versus kernel maturity is destructive and time consuming, leaving the hull scrape as the best possible technique.
X-ray technology is the oldest and most frequently used form of medical imaging. Advances in x-ray technology have moved this technology out of the medical field to other disciplines. Imaging with x-rays involves exposing all or part of an object in question to a small dose of ionizing radiation to produce pictures of the objects internal and/or external density depending on x-ray power and intensity. X-ray technology has been an accepted practice for many years in food processing, pharmaceuticals, and manufacturing industry for contaminate detection, inspection, counting, material integrity, and damaged product. For instance, Haff et al. (2013) used x-ray to identify pitted and non-pitted cherries before being processed for human consumption. This x-ray technique with improved algorithms was able to detect 100% of missed non-pitted cherries. Other research used x-ray films to identify translucent and non-translucent pineapples (Haff et al., 2006). There was a high correlation between the likelihood of a sample being rated as good and the actual condition of the fruit. Samples with no translucency were correctly identified 93% of the time, while those with extreme translucency were correctly identified 80% of the time. The results indicate that x-ray imaging is a useful method for selecting pineapples that are most likely to be free of translucency as well as those most likely to be extremely translucent. Pearson et al. (2014) used x-ray technology, both film and digital images, to identify insect damage in sunflower seeds. Recognition of insect damage was better for film than digital images due to low quality digital technology. The lower recognition rates for the x-ray system (digital) were due to lower resolution and higher noise in the digital images when compared with film images.
It is proposed that x-ray technology may have the capability of scanning the peanut kernel through the hull to possibly determine density and ultimately maturity. The objective of this project was to determine if x-ray could be used as a quick, non-destructive, and precise method to determine peanut maturity.
Materials and Methods
This research was conducted at National Peanut Research Laboratory located in Dawson, GA (31.760709, -84.435603). Peanut samples from cultivars Georgia-06G (runner; Branch, 2007), Georgia-13M (runner - high oleic; Branch, 2014), Georgia-11J (virginia; Branch, 2012), and AT9899-14 (spanish - high oleic: AgraTech; trademark/registration date, 2012; https://trademarks.justia.com/850/01/at-85001506.html) were grown off-site and transferred to the lab for processing. Peanut crops were grown using best management practices for maximum yield and quality. An overhead irrigation system was used, and irrigation events were scheduled using soil water potential sensors (MPS-2, Decagon Devices, Inc. 2365 NE Hopkins Court, Pullman, WA 99163). Pesticides (herbicides, insecticides, and fungicides) were applied at manufacturers recommended rates and timing when problems were detected by field scouting.
Peanut sampling began about 110 days after planting and was sampled every 7 to 10 days, depending on weather conditions, until peanuts were over 150 days after planting. There were seven different harvest dates. At each sampling date approximately 3-m of crop row were hand dug in each cultivar, washed with tap water, and pods removed manually using scrub boards. A scrub board was a 0.61 by 0.61-m metal frame about 1.2- m high with 25 by 38-mm diamond shaped expanded metal mesh top. The peanut plant was scrubbed across the expanded metal to remove peanut pods from the plant. The pods would fall through the expanded metal into a catchment pan. Pods were bagged in plastic mesh bags and returned to the lab.
Pods were re-washed, and hand cleaned to remove all foreign material such as leaves, stems, and pegs. Pods were then divided in half using a riffle divider. One half of the sample was hull scraped and placed into color classes (White, Yellow 1, Yellow 2, Orange, Brown, and Black) using the maturity color profile board. The other half was hull scraped, and each peanut was placed within each color profile within each color class (describe below).
Hull scraping consisted of removing the pod exocarp using a high-pressure washer with water. Once the exocarp was removed, pods were placed into individual columns based on the subjective classification of their mesocarp color. In general, the maturity board is divided into six color classes - White, Yellow 1, Yellow 2, Orange, Brown, and Black - and into individual columns within each color class that represent successive stages of development (Williams and Drexler, 1981; Rowland et al., 2006) for a total of 25 columns on the board. Getting white colored peanuts through the blasting process was difficult as these immature pods are quite soft and tend to disintegrate under high power washing. The procedure was to "blast" with water for a short time period and remove white colored pods before pod disintegration, if possible. This process was accomplished multiple times until all pods had the exocarp removed that hull color could be clearly seen in the peanut saddle.
The first half of the sample was boarded into the six color classes and then dried on fan forced air dryers with temperatures not to exceed 35C. These samples were used to determine overall peanut maturity and the sample saved for future reference, if needed. The other half-sample was x-rayed, blasted, re-x-rayed, and then placed on the color profile board into their respective colors and profiles within color. There were three individuals who profiled peanuts. The same individual profiled both the virginia and spanish market type while the other two individuals profiled only the runner type. Once boarded, each individual profile column was x-rayed, saved in individual mesh bags, dried with forced air dryers (same as above) and x-rayed again. At the end of the season, pods were combined by cultivar and by column color profile and x-rayed again.
The x-ray machine was a proprietary product designed specifically for the National Peanut Research Laboratory by TOMRA Sorting NV (Research Park Haasrode 1622 Romeinse straat 20, 3001 Leuven, Belgium). Software algorithms and parameters were refined over a 6-year period to enable the x-ray to identify individual peanut pods/kernels from foreign material with the end result being a farmer stock grade. Software algorythms use the x-ray component to classify peanuts by size, density, and gray scale to determine an acceptible grade (unpublished data) compared with manual classification using USDA official grading procedures (USDA,1993). For this project, the algorithms were modified to classify each pod/kernel by size, density, and gray scale to output an unitless x-ray value instead of an overall grade factor.
Once the peanuts were dried, computer x-ray algorithms identified the kernel area within the hull and the density of the kernel. X-ray of kernels show a surface area measured in pixels and proprietary algorithms convert the number of pixels to surface area and record a value. The denser the kernel the darker the color value, gray scale, recorded. These gray scale values are a measure of kernel density. Kernel area is a pixel value and the proposed x-ray density numbers are a gray scale value. Therefore, multiplying the surface area by gray scale would give an indication of implied kernel density.
After data collection, x-ray values of wet peanuts, dry peanuts, and variouse combinations of basic statistics (average, standard deviation, frequency, linear regression, etc.) were compared with manual hull scrape color profiling.
Results and Discussion
Peanut Sample Collection
There were a total of seven sampling dates through the summer. Table 1 shows the total number of pods that were blasted and boarded for each cultivar over all sampling dates. Immature pods in the white color class had the least number due to loss during the pod blasting proceedure. Mature pods in the black color range (20 to 25) were also difficult to collect. Once a peanut pod matures, peanut pegs can begin to deteriorate, and that peanut can be lost even during careful hand digging (Chapin and Thomas, 2005; Sorensen et al, 2015). The black class had less total pods for both runner and virginia market type compared to the other color classes, except the white class, implying possible pod loss. The peanut maturity profile board was developed for runner market type peanuts and not for virginia or spanish market types. The spanish pods seemed to follow the runner pod color change from white through yellow, orange, brown, and to black. Spanish pod numbers were somewhat uniform in total numbers for each color class. However, the virginia type peanut (Georgia-11J) was much more difficult to board. After hull scraping/blasting, the mesocarp color tended to be highly spotted with dark and light areas in random areas on the pods. Pods were darker colored on one side and only in the saddle while the other side of the peanut would remain a Yellow 2 type color. The areas that did change colors, tended to move through the color classes, but this "Holstein" type coloration made boarding difficult to determine maturity.

Total number of pods that were collected for each cultivar in each color class and maturity profile over all sampling dates during 2015.
Hull Scrape Versus Non Hull Scrape
Exocarp removal with a pressure washer occurred on freshly dug peanuts in order to determine hull color for maturity determination. It would seem possible that removing part of the peanut hull may change peanut area and possibly kernel density values determined by x-ray. Peanut pods were x-rayed before and after hull scraping. Table 2 shows the average pixel area and kernel gray scale values area for each peanut market type. In general, hull scraping reduced the observed peanut area values by about 25 percent for runner and virginia market types and only 10 percent for the spanish market type. Gray scale values were also reduced by about these same values, 25 an 10%, for virginia and spanish market type, respectively. A possible reason for the decrease in peanut area could be that x-ray cannot differentiate between hull and kernel of freshly dug peanut and would therefore take the whole pod as a kernel (more detail described below). The x-ray may also take the area of a double kernel pod as one big kernel. After hull removal, x-ray values would decrease for less area, and possible breakage of the double kernel pods. Also, with partial hull removed, the x-ray may be able to better see two individual kernels in the double pod peanut thereby reducing area.
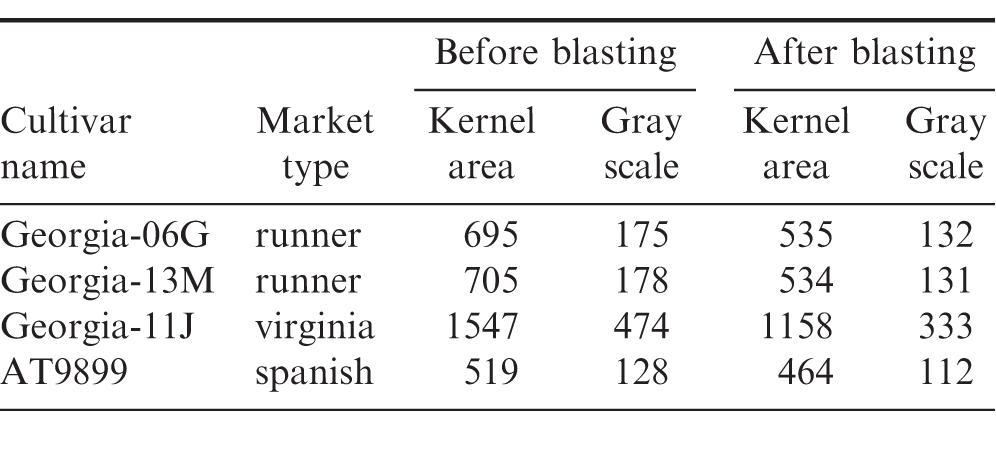
Measured x-ray area and gray scale values for peanut before and after hull scraping pods with high pressure washer to remove exocarp to reveal hull color.
X-ray Pod Profiles
Figure 1 shows the average x-ray values for the green picked (wet) peanut cultivars during the growing season for individual maturity profiles. Cultivar Georgia-11J had much higher x-ray values across all maturity profiles compared with the other cultivars. Spanish AT9899, on the other hand, had lowest values across all maturity profiles. There was no difference in x-ray values between the two runner type cultivars, Georgia-06G and Georgia-13M. The higher and lower values for the Georgia-11J and AT9899, respectively, can be directly associated with pod and kernel size.
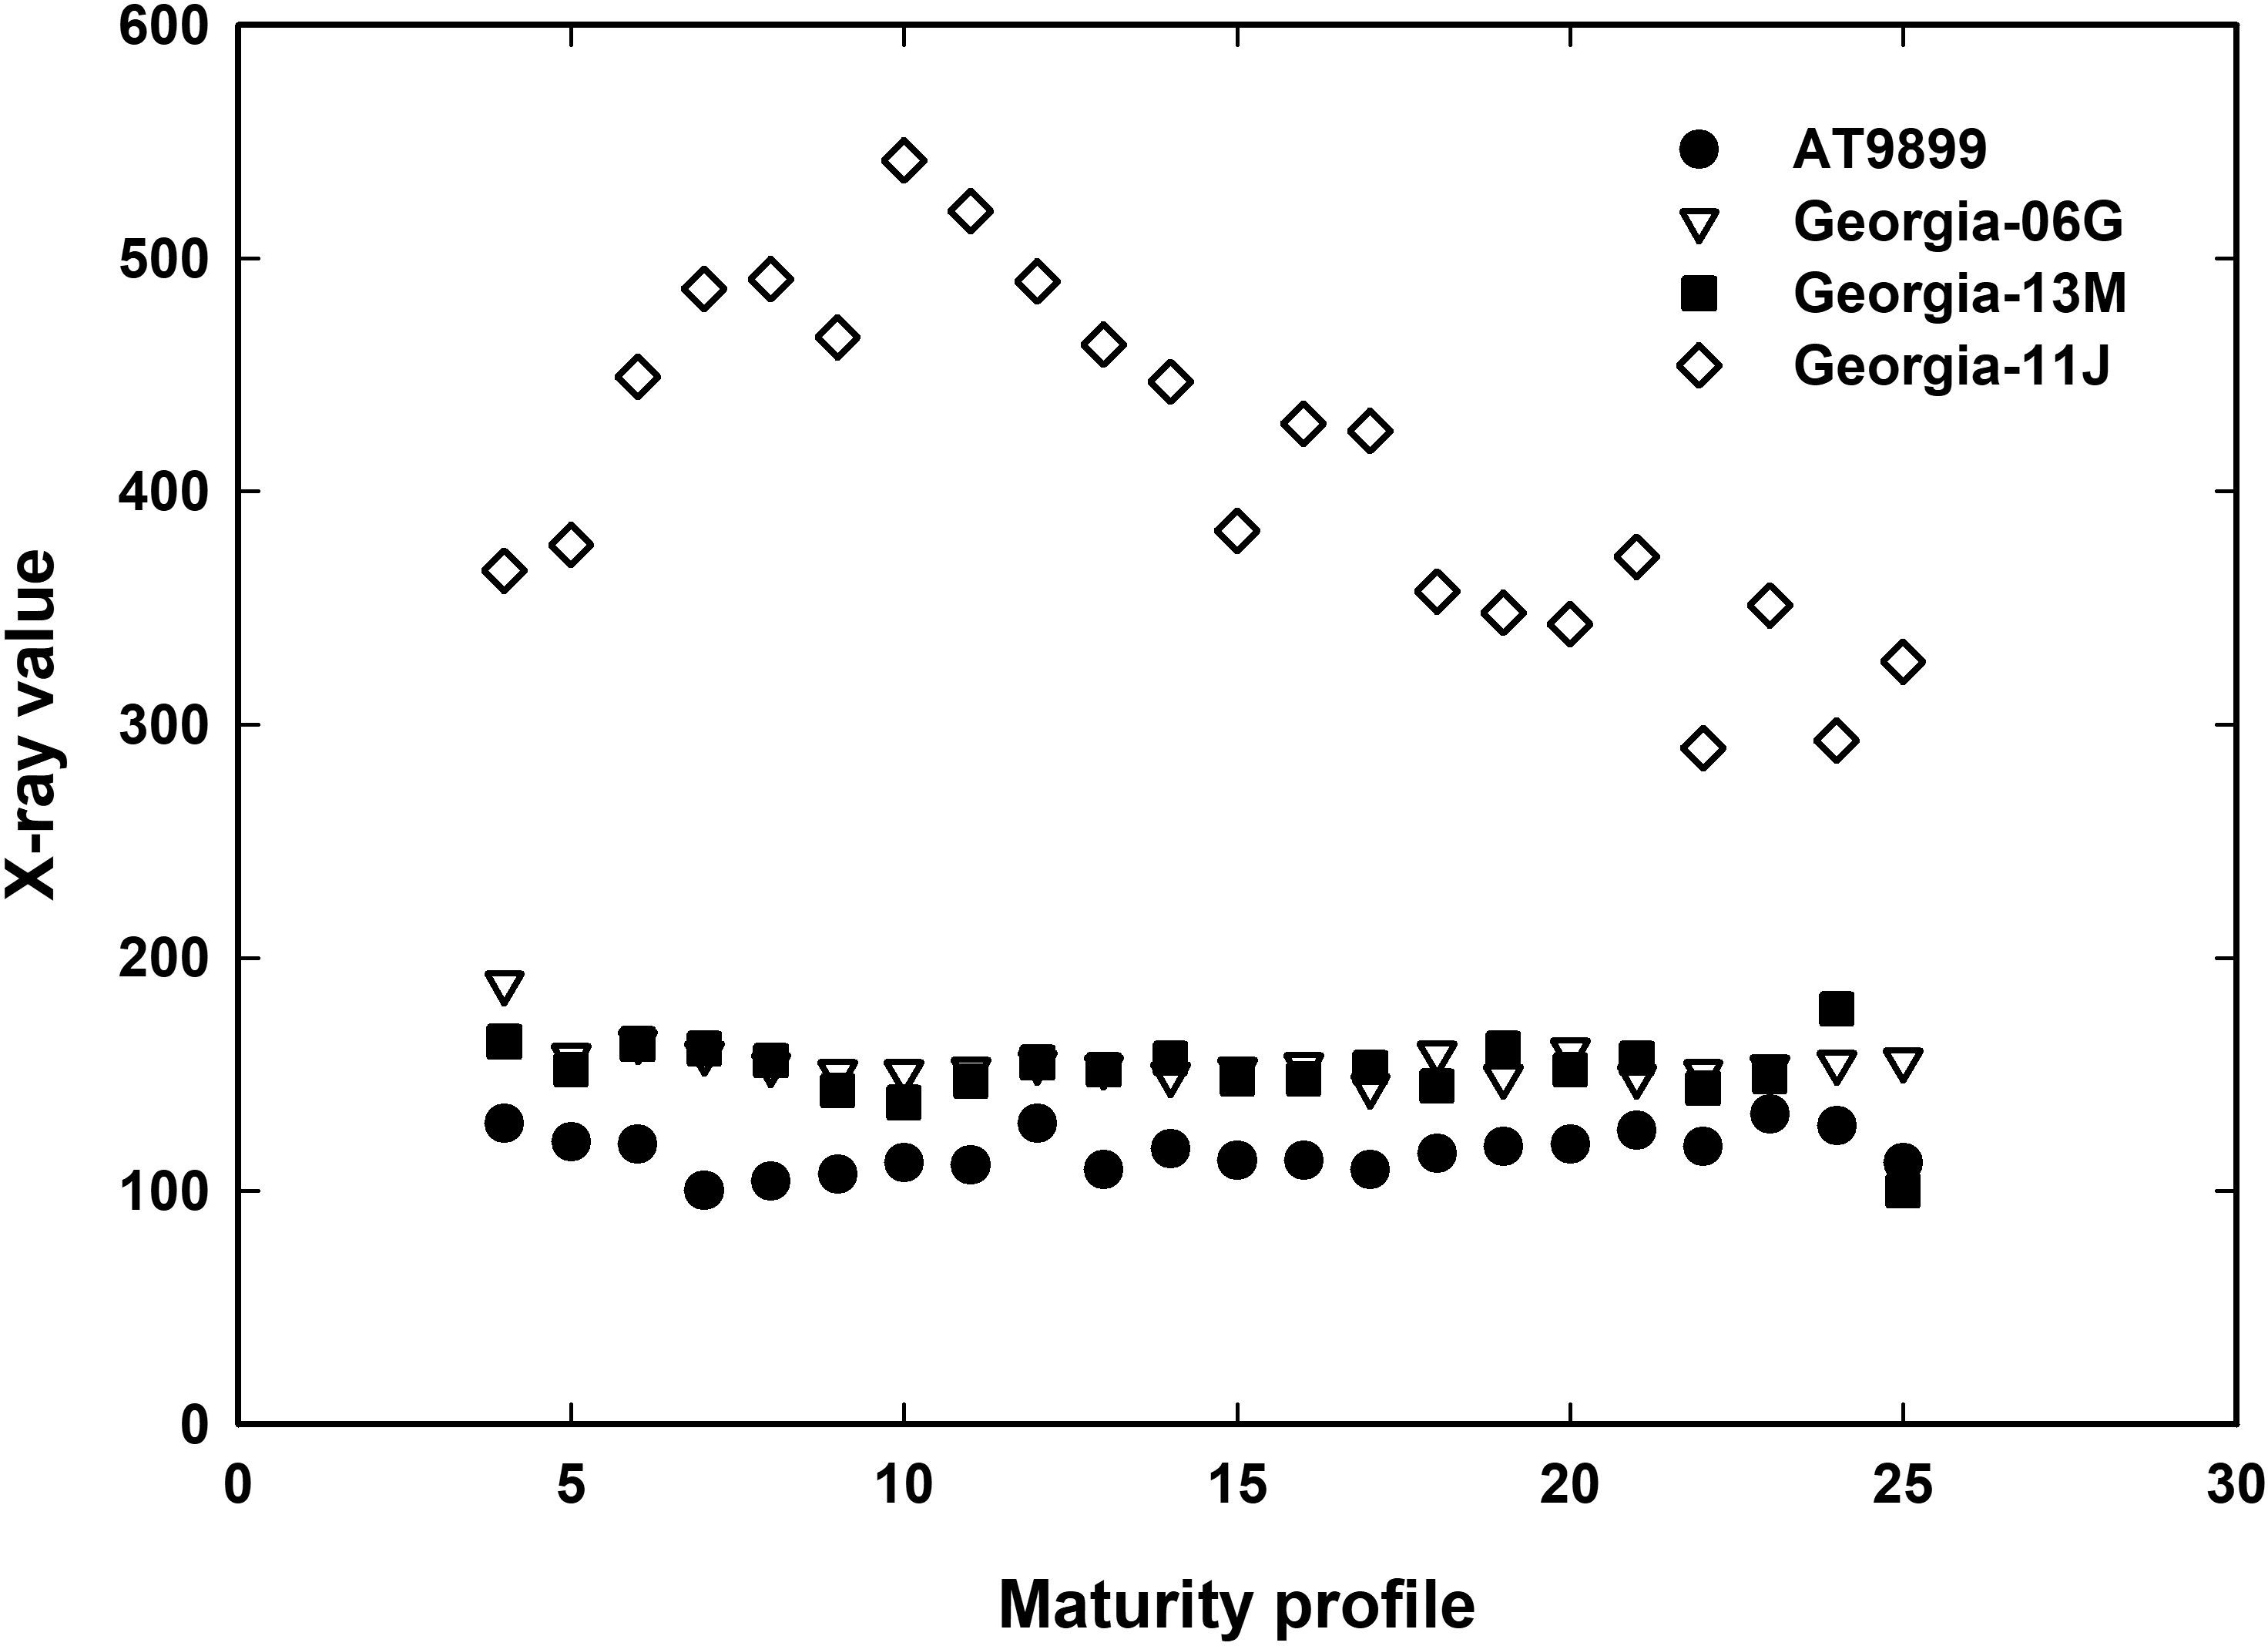
The average x-ray value for wet peanuts compared with maturity profile for four peanut cultivars during the 2015 growing season.
It was hypothesized there would be an increase in x-ray value with increased maturity level or density of peanut. Since this did not occur for wet peanuts (green picked) and values for immature peanuts were similar in value to mature peanuts was probably related to kernel moisture and kernel size. It is known from x-ray proprietary algorithms that kernel size will affect kernel x-ray measurements. During the drying process, immature peanuts will shrink and shrivel as water is released from the kernel reducing both size and density of the original immature kernel. It was then hypothesized that with fresh dug peanuts, water content was masking the true density of the peanut and x-ray was probably measuring the density of water plus the kernel. In addition, the x-ray may not differentiate the kernel from the hull. This is because there is no space between the kernel and the hull until after drying and the kernel shrinks and pulls away from the hull. It was concluded that with this x-ray system, peanuts would need to be dried to determine maturity by removing water and allowing the kernel to shrink so the x-ray could distinguish between kernel and hull and to remove water that might be masking true kernel density.
Figure 2 shows the average dry kernel x-ray values for the four cultivars across the growing season for individual maturity profiles. Again, cultivar Georgia-11J had much higher x-ray values across all maturity profiles compared with the other cultivars. Spanish AT9899, had lowest values across maturity profiles 10 to 23, but had similar values to the runner type peanuts at the immature and more mature profile categories. The commonality of runner and spanish peanuts having the same values in the Black class, profile 24 and 25, could be associate with the total number of pods available to measure especially in profile number 24 and 25 for the cultivar Georgia-13M (see Table 1). More than likely, if there were more pods were available in profile 24 and 25 for Georgia-13M, the values would probably more like those found in Georiga-06G. Both runner cultivars were similar to each other across all maturity profiles. Also, the lack of Black class peanuts for Georgia-13M may be genetic. It has been noted by others (UGA researchers and extension personnel at local meetings with growers) that Georgia-13M does not exhibit a black color exocarp with maturity resulting in confusion for digging dates of this cultivar.

The average x-ray value for dried peanuts compared with maturity profile for four peanut cultivars during the 2015 growing season.
X-ray values increased linearly for the two runner and spanish cultivars up to about maturity profile number 14 with R2=0.97. After that maturity value, x-ray values did not increase but stayed constant. Maturity profile number 14 is at the beginning of the orange class. The virginia type class peanut showed a linear relationship with maturity till about maturity profile 18 (R2=0.99) which is the middle of the brown color class.
Overall, there was a linear relationship with x-ray value versus maturity. This implies that x-ray could be used as an indicator of kernel maturity. This linear relationship ceases at some point in maturity depending on peanut market type. It is unclear why the linear relationship stops at specific points for specific peanut market types. Possible reasons could be related to x-ray equipment, calibration, and/or existing calibration algorithms. These algorithms are based on kernel size and gray scale color which is related to density. Once the peanut has reached its full size, about orange and brown class, then the x-ray would only see density differences in gray scale color. Therefore, more research would be needed to refine the present x-ray calibration gray scale algorithms to match peanut maturity determined by the hull scrape method.
Kernel Area and Density
Figure 3a shows the x-ray area of Georgia-06G, Georgia-13M, Georgia-11J, and AT9899 kernels. All cultivars have a strong linear relationship with pixel area versus column maturity to about column 15 to 18 depending on cultivar. At this maturity, the kernels have reached their maximum area and do not increase but remain relatively constant to column 25. Runner peanut cultivars Georgia-06G and Georgia-13M have similar curves indicating no kernel density difference in normal (Georgia-06G) versus high oleic (Georgia-13M) peanut kernels.
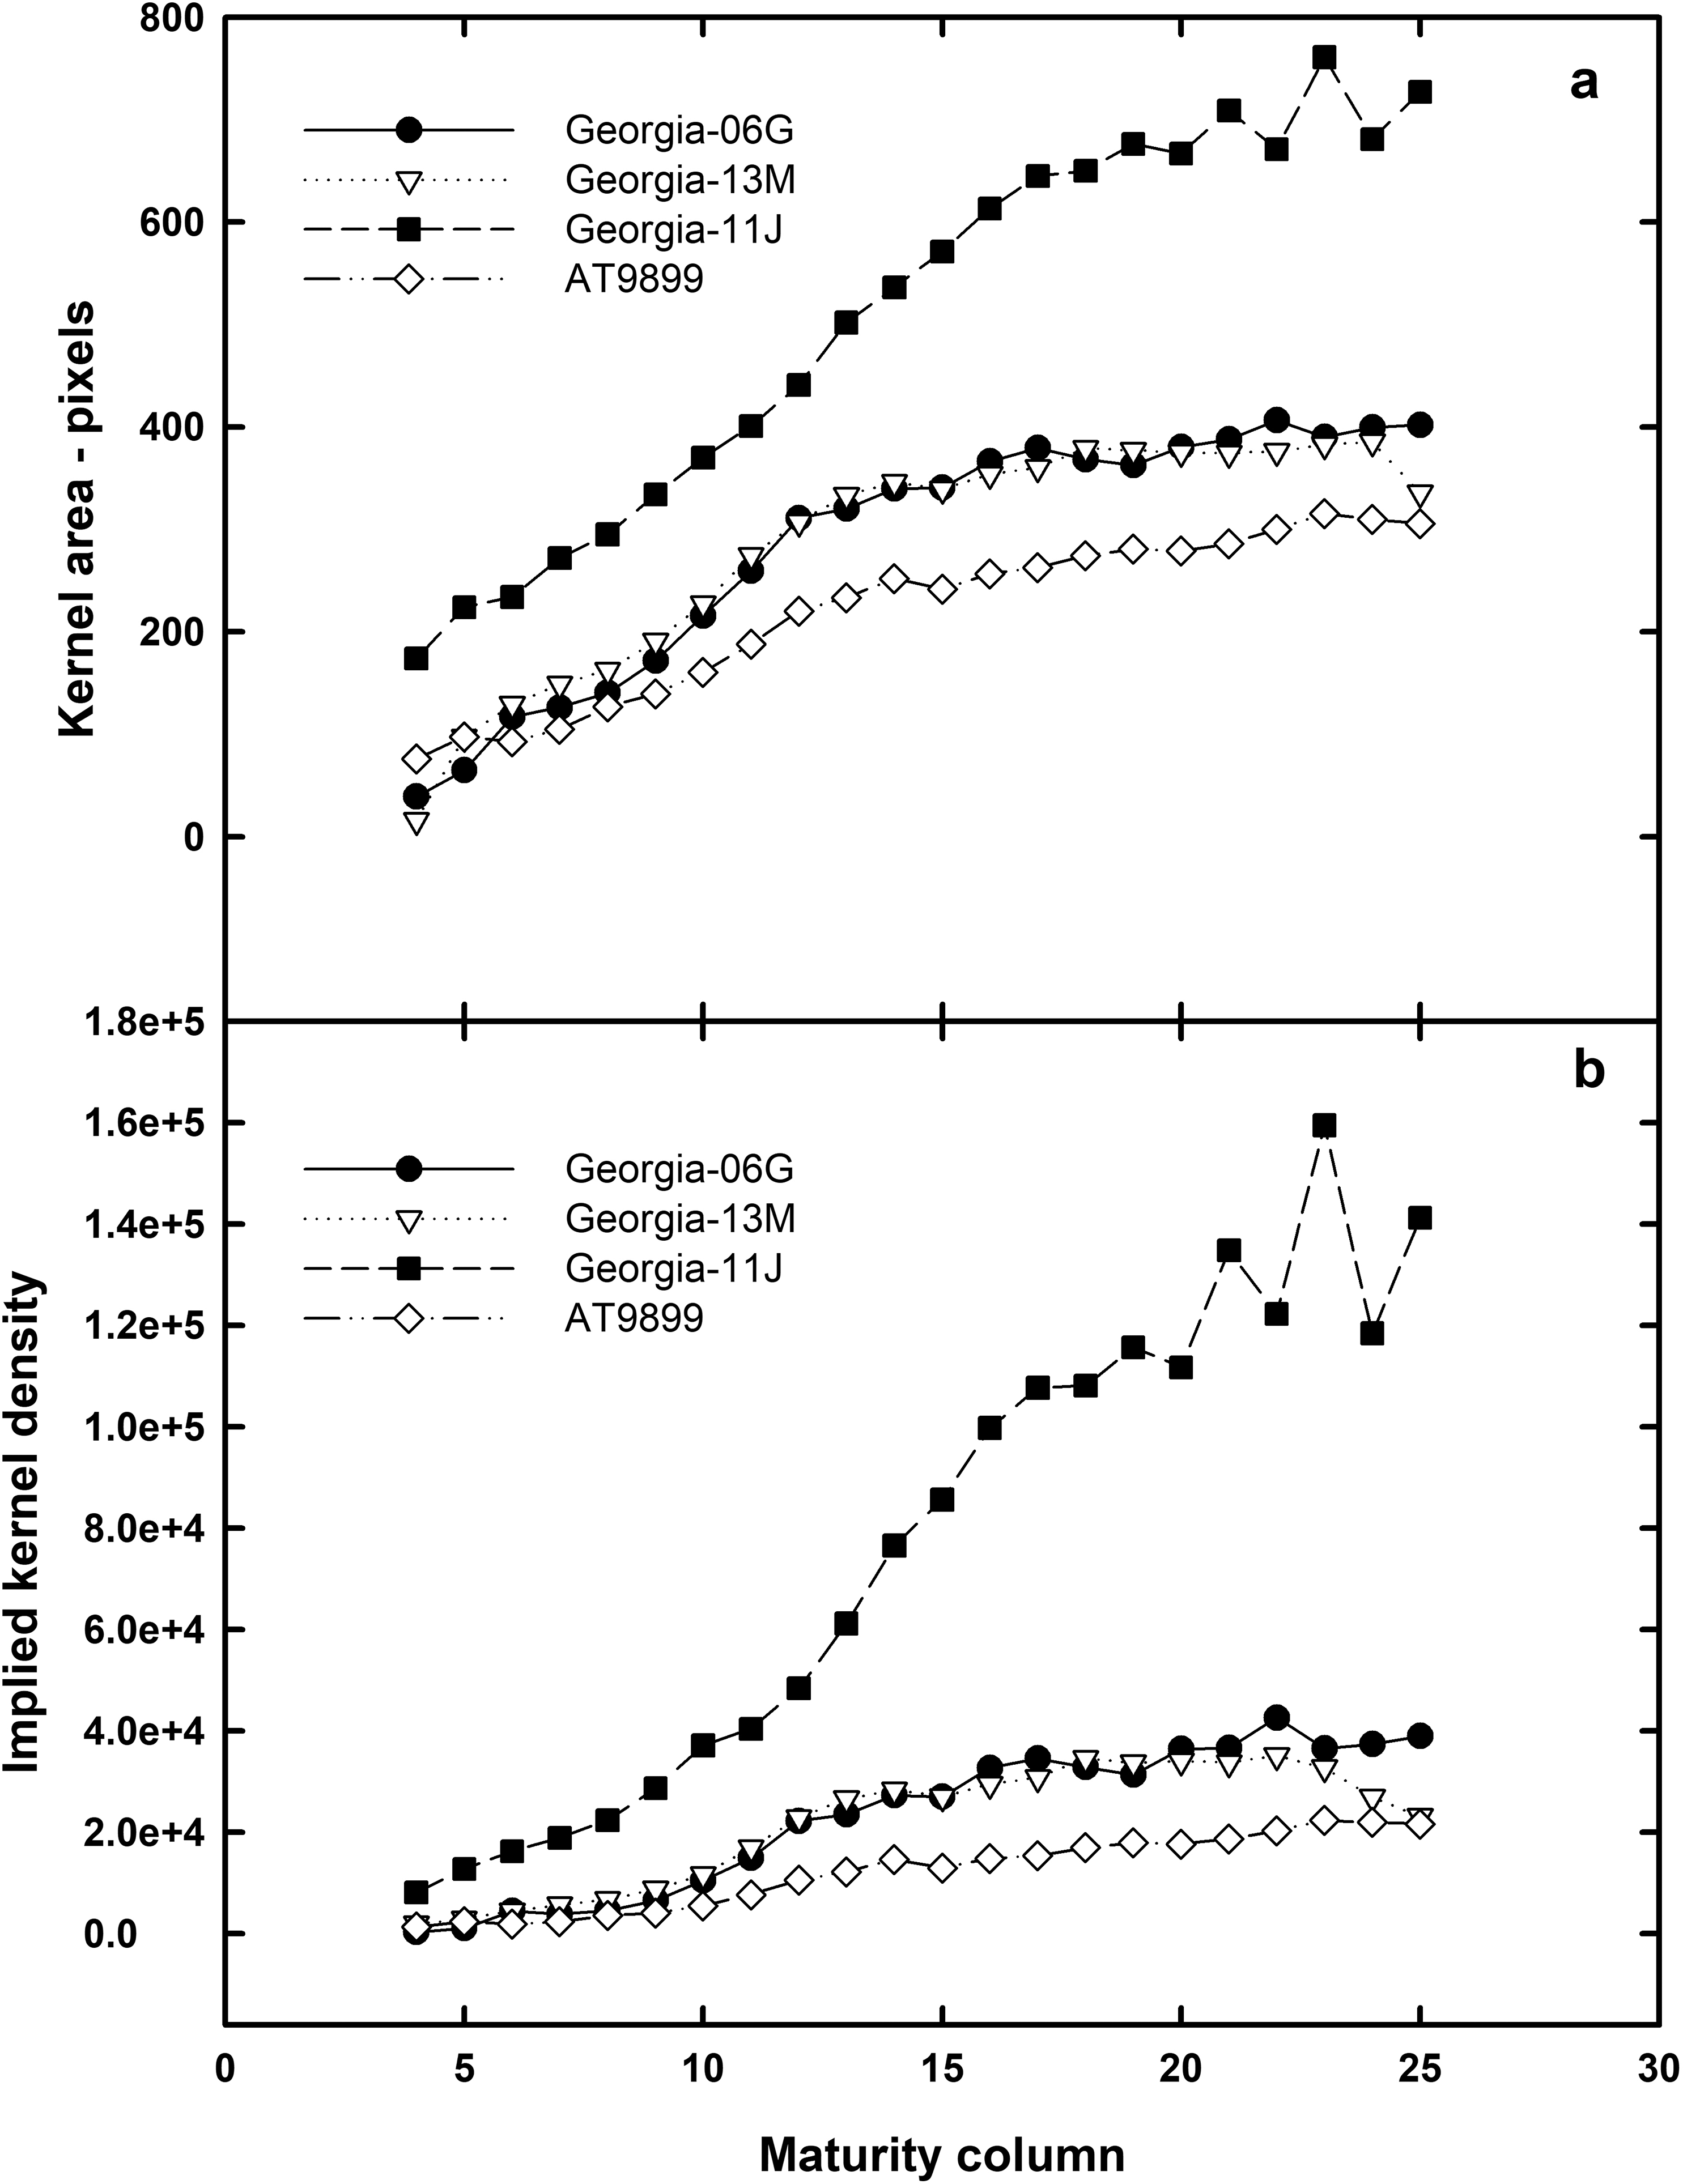
X-ray kernel area (a) and implied kernel density (b) for three peanut market types by pod maturity profile.
Figure 3b shows the values of implied kernel density for the three market peanut types. As expected, since the gray scale value corresponds with kernel area, the shape of the curves for peanut density are similar for each peanut market type as shown in Figure 3a for kernel area. The kernel density correlation coefficient (R2) for the two runners and virginia market types and spanish cultivars are 0.922, 0.751, 0.949, and 0.967, respectively. The coefficient for the Georgia-13M is lower than the other peanut cultivars is probably due to the total number of kernels available at columns 24 and 25 for analysis (5 in column 24 and 1 in column 25, see Table 1). Removing these two column data points, the R2 for Georgoa-13M then becomes 0.912 almost identical to Georgia-06G. These correlation coefficients imply that x-ray could indicated peanut density, however, to get a true kernel density value, more work would need to be completed with various x-ray strengths, and updated algorithms that relate gray scale to kernel density.
X-ray Color Class
All peanut gray scale values from each profile were combined with color classes of Yellow 1, Yellow 2, Orange, Brown, and Black. Using the average standard deviation of about 20 (data not shown), peanuts were grouped into x-ray frequency classes of values between 0 to 20, 20 to 30 and so on to 200 for the runner and spanish cultivars and to 400 for the virginia cultivar. Figure 4 shows these frequency percentage values for Georgia-06G, AT9899, and Georgia-11J. Georgia-13M and Georgia-06G have similar values such that only Georgia-06G will be shown. Total number of peanuts within an x-ray frequency range does show a progressive increase of x-ray values with color class for Yellow 1 and Yellow 2 for both Georgia-06G and AT9899 with Orange, Brown, and Black color class by x-ray value being similar. Cultivar Georgia-11J showed three distinct frequencies by x-ray value relationships for Yellow 1, Yellow 2, and Orange with Brown and Black being similar.
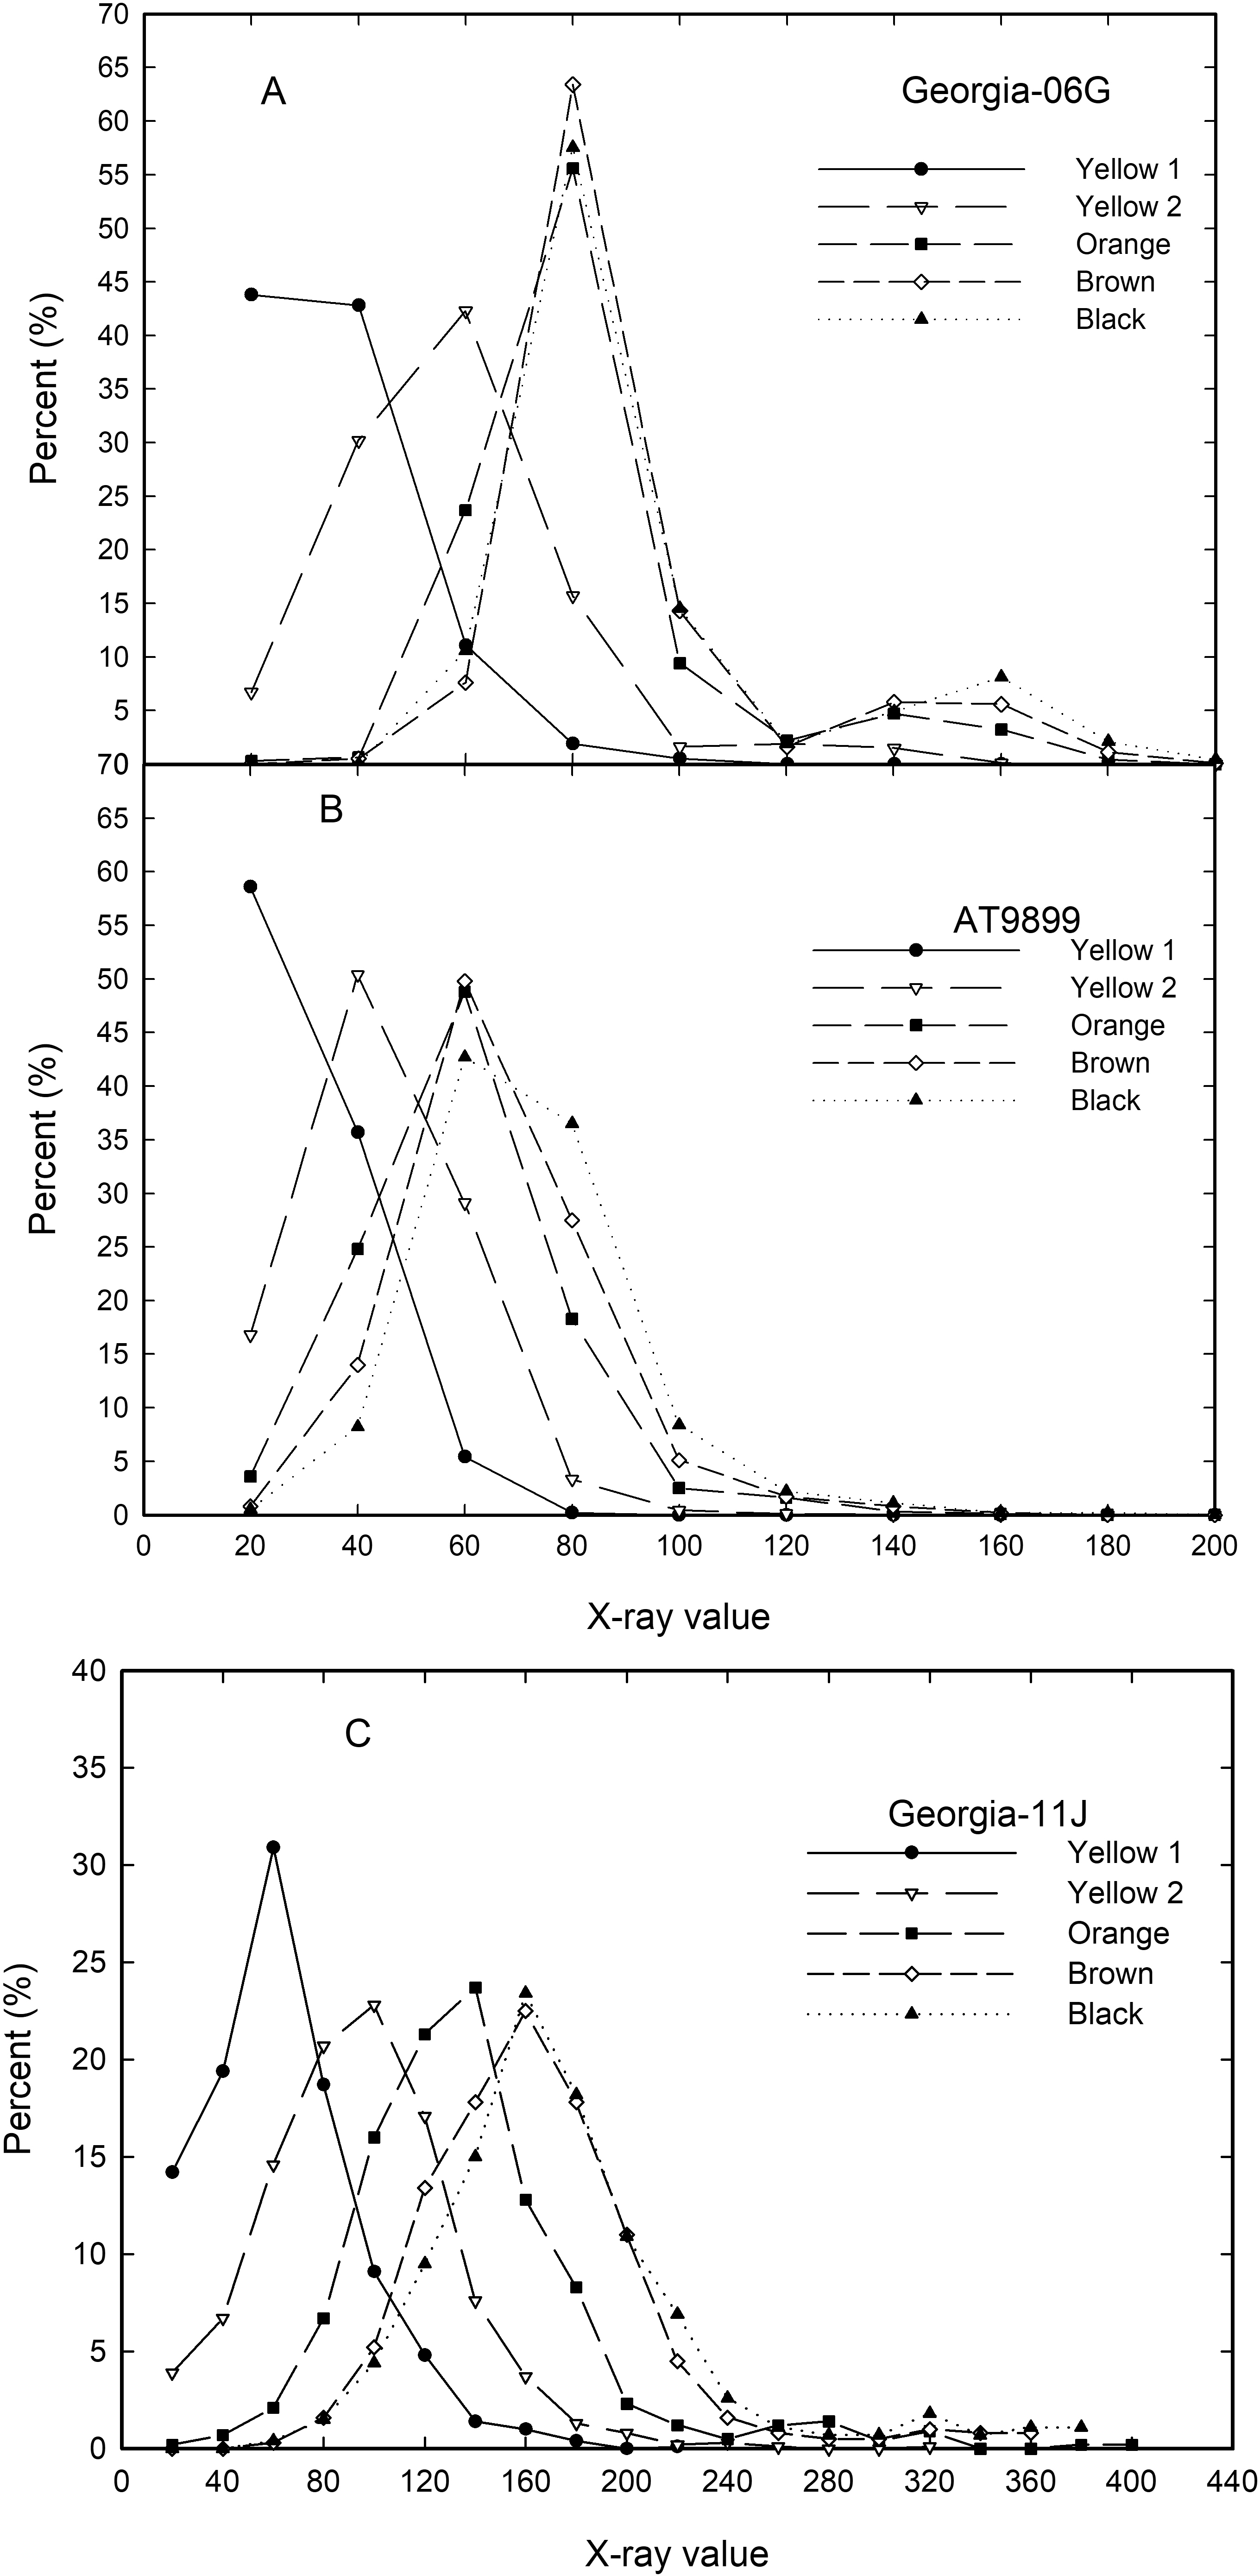
Frequency of the number of peanuts in a specified x-ray value (0-20, 20 to 40,...) of pods manually classed into the five color classes of Yellow 1, Yellow 2, Orange, Brown, and Black for runner (A), spanish (B), and virginia (C) market class peanuts.
Manual and X-ray Pod Profiles
The relationship between peanut maturity and x-ray values seems to peak at about the Orange class for Georgia-06G, Georgia-13M, and AT9899 while Georgia-11J tends to peak at about the Brown class. This peak in x-ray is probably about the same time that peanut size is also maximized. Once the peanut kernel reaches full size (about Orange color class) there was no difference in number of kernels (percent of total) by x-ray value relationship. This is probably due to the algorithms used by manufacturer to calculate the x-ray values (discussed previously).
To confirm this, a comparison of the percentage of peanut within specific x-ray values was compared with peanuts that were placed manually on the profile board. This comparison was across three sample dates. Figure 5 shows the number of peanut pods for cultivar Georgia-06G that were manually placed on a profile board by visual inspection for each of three harvest dates 13 August, 15, and 30 September. There are a progressively higher number of peanuts moving through the maturity profiles towards maturity. By 15 September the maximum number of peanuts centered about profile number 17 which is the beginning of the brown class. By 30 September, most kernels matured to profile number 22 which is the center of the black class. By using the color maturity profile board, we can see peanut maturity progressed through the growing season. All cultivars tended to follow this pattern of peak number of peanuts progressively moving through each color grade, therefore, only Georgia-06G is shown.
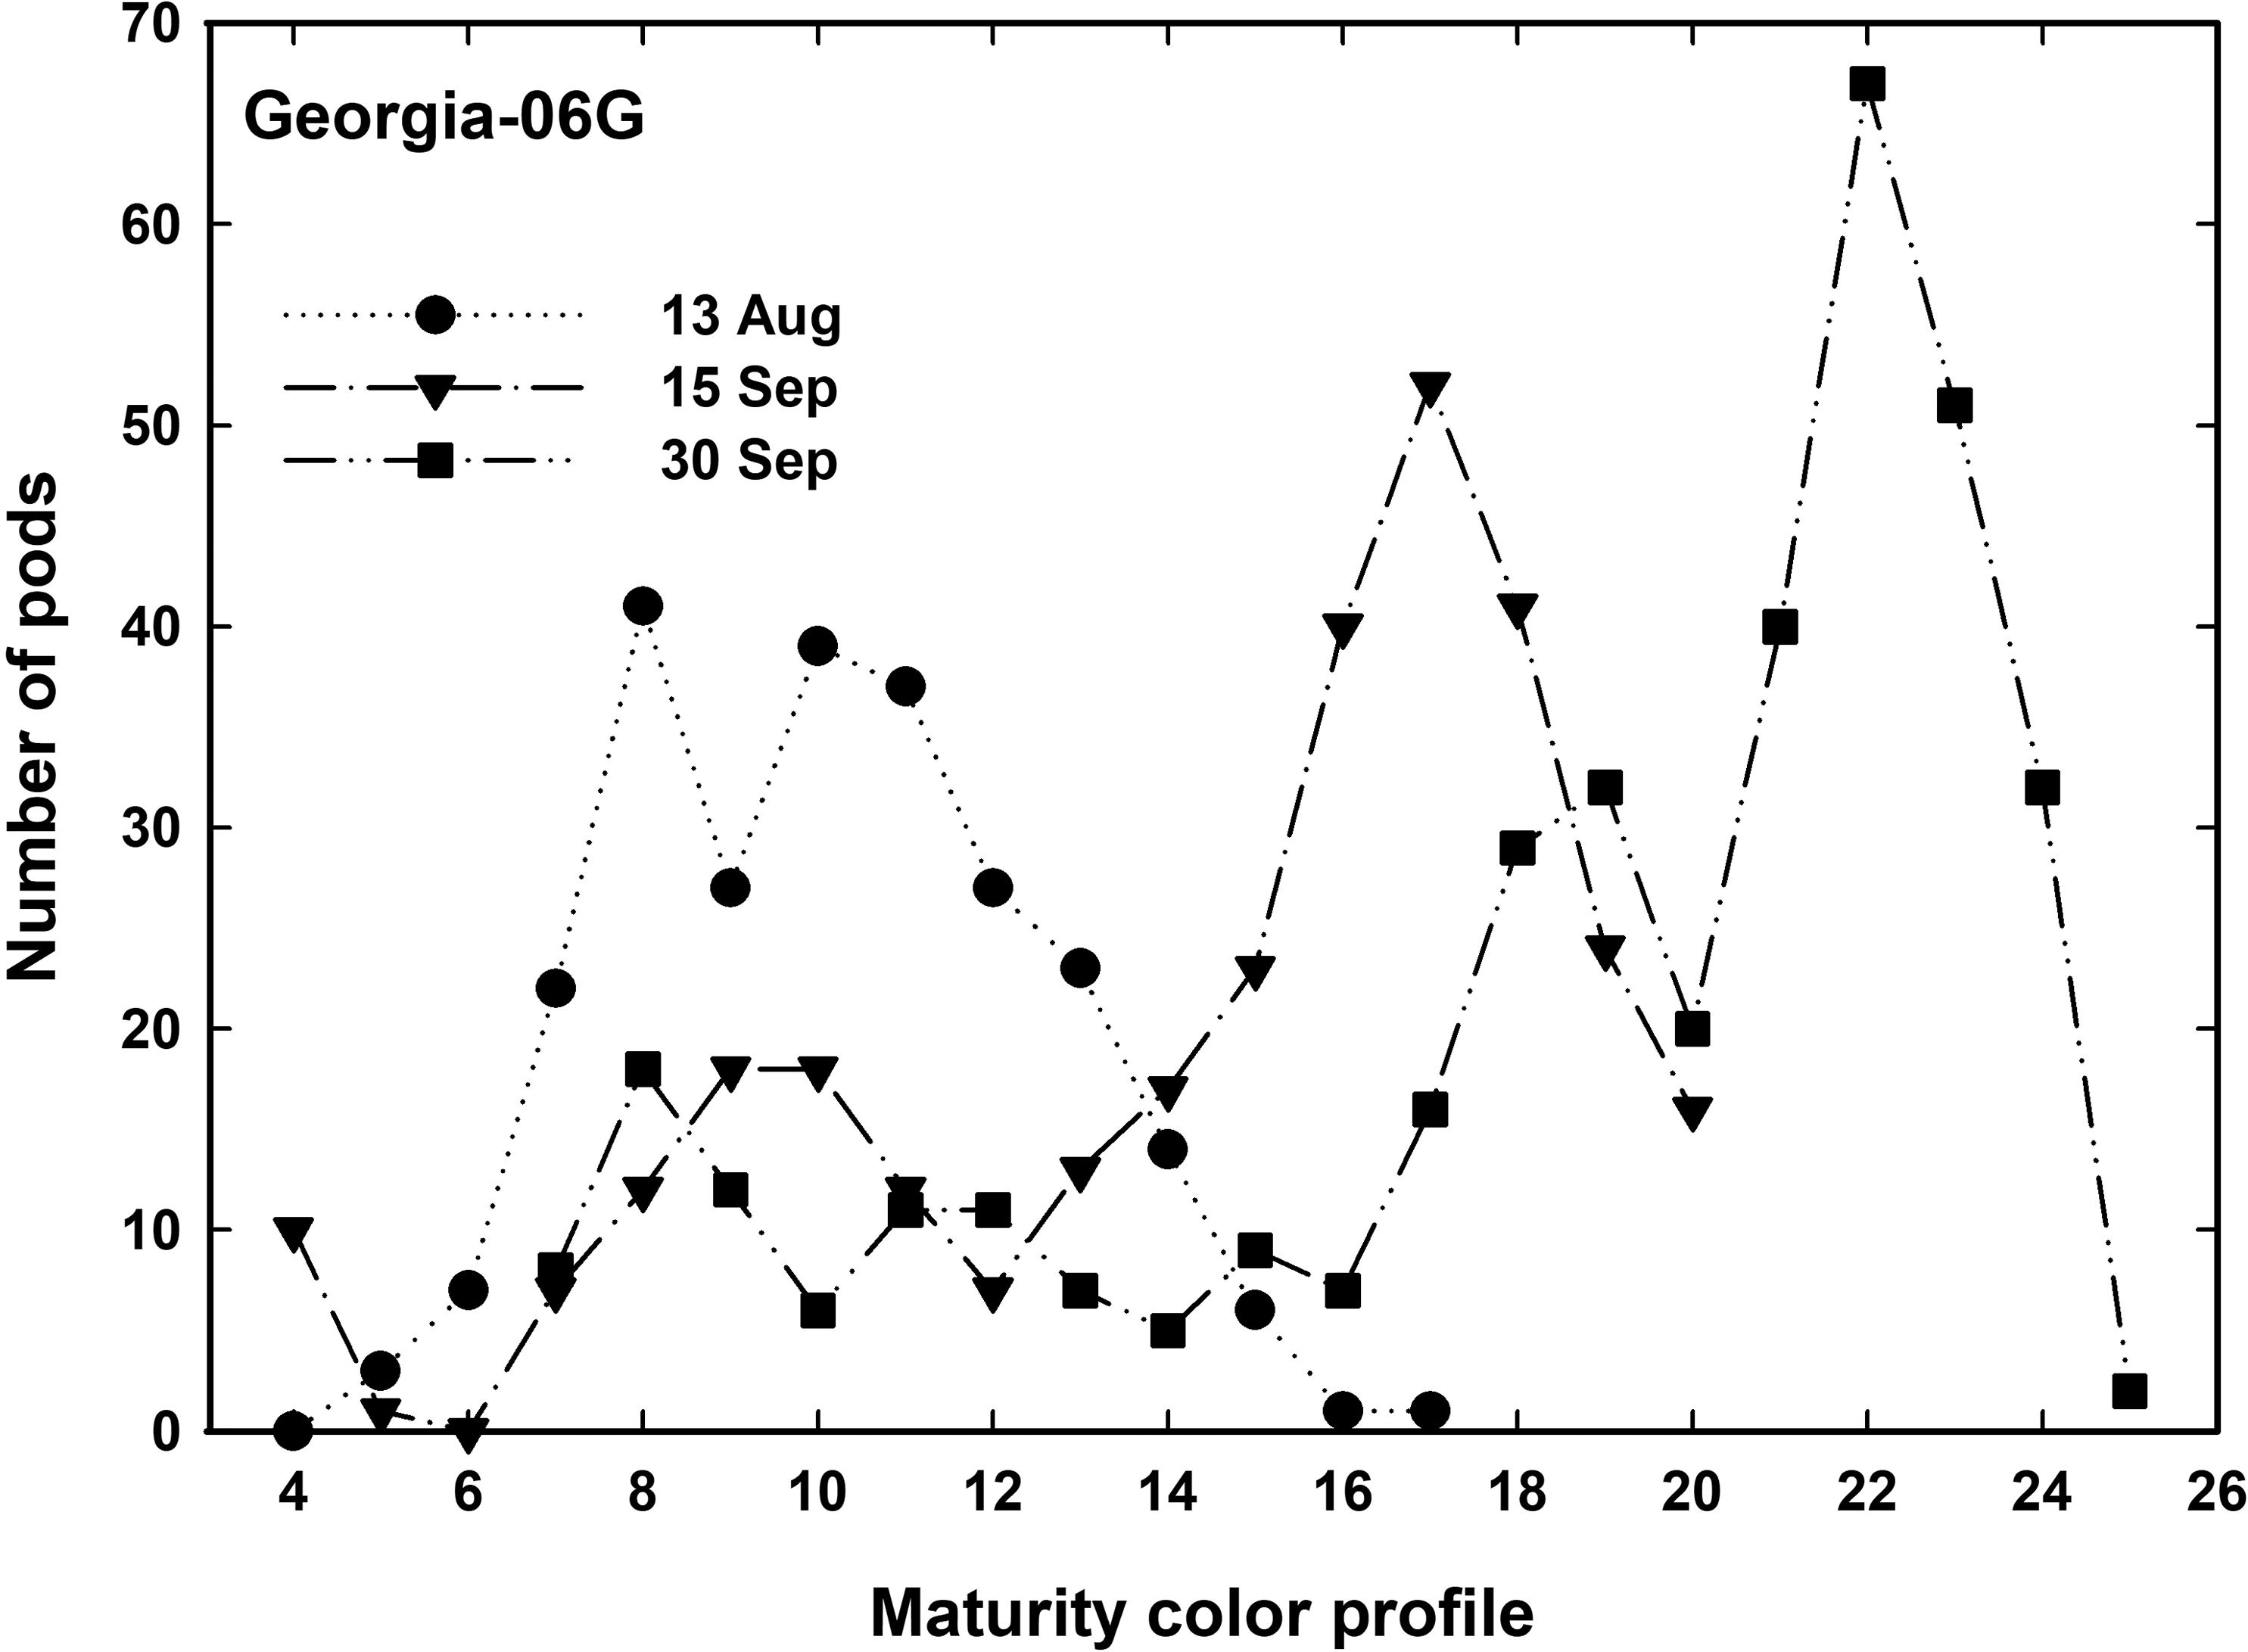
Peanut pod maturity placed manually on profile board (Georgia 06G) for sample dates 13 August, 15, and 30 September.
Figure 6 shows the relationship of the frequency (percent) of peanuts within a range of x-ray values (0 to 20, 20 to 30,...200) by the three sample dates described above. The early sampled peanuts (13 August) have a higher percentage of peanuts in the lower x-ray values than the peanuts sampled at the later dates. The early date has the similar shape and amplitude as the same date shown in Figure 4. The next two sample dates (15 and 30 September) has the same shape and amplitude as each other implying the x-ray cannot detect a more mature peanut. The shape and amplitude of the curve for these later sampled peanuts are similar to those in Figure 4 except the 30 September curve is out of phase and theoretically should have moved to a higher x-ray value. As discussed previously, the possible reason for the 30 September curve not shifting to a higher x-ray value is due to existing calibration algorithm relationship between peanut size, peanut density, and gray scale value used by the proprietary x-ray equipment.
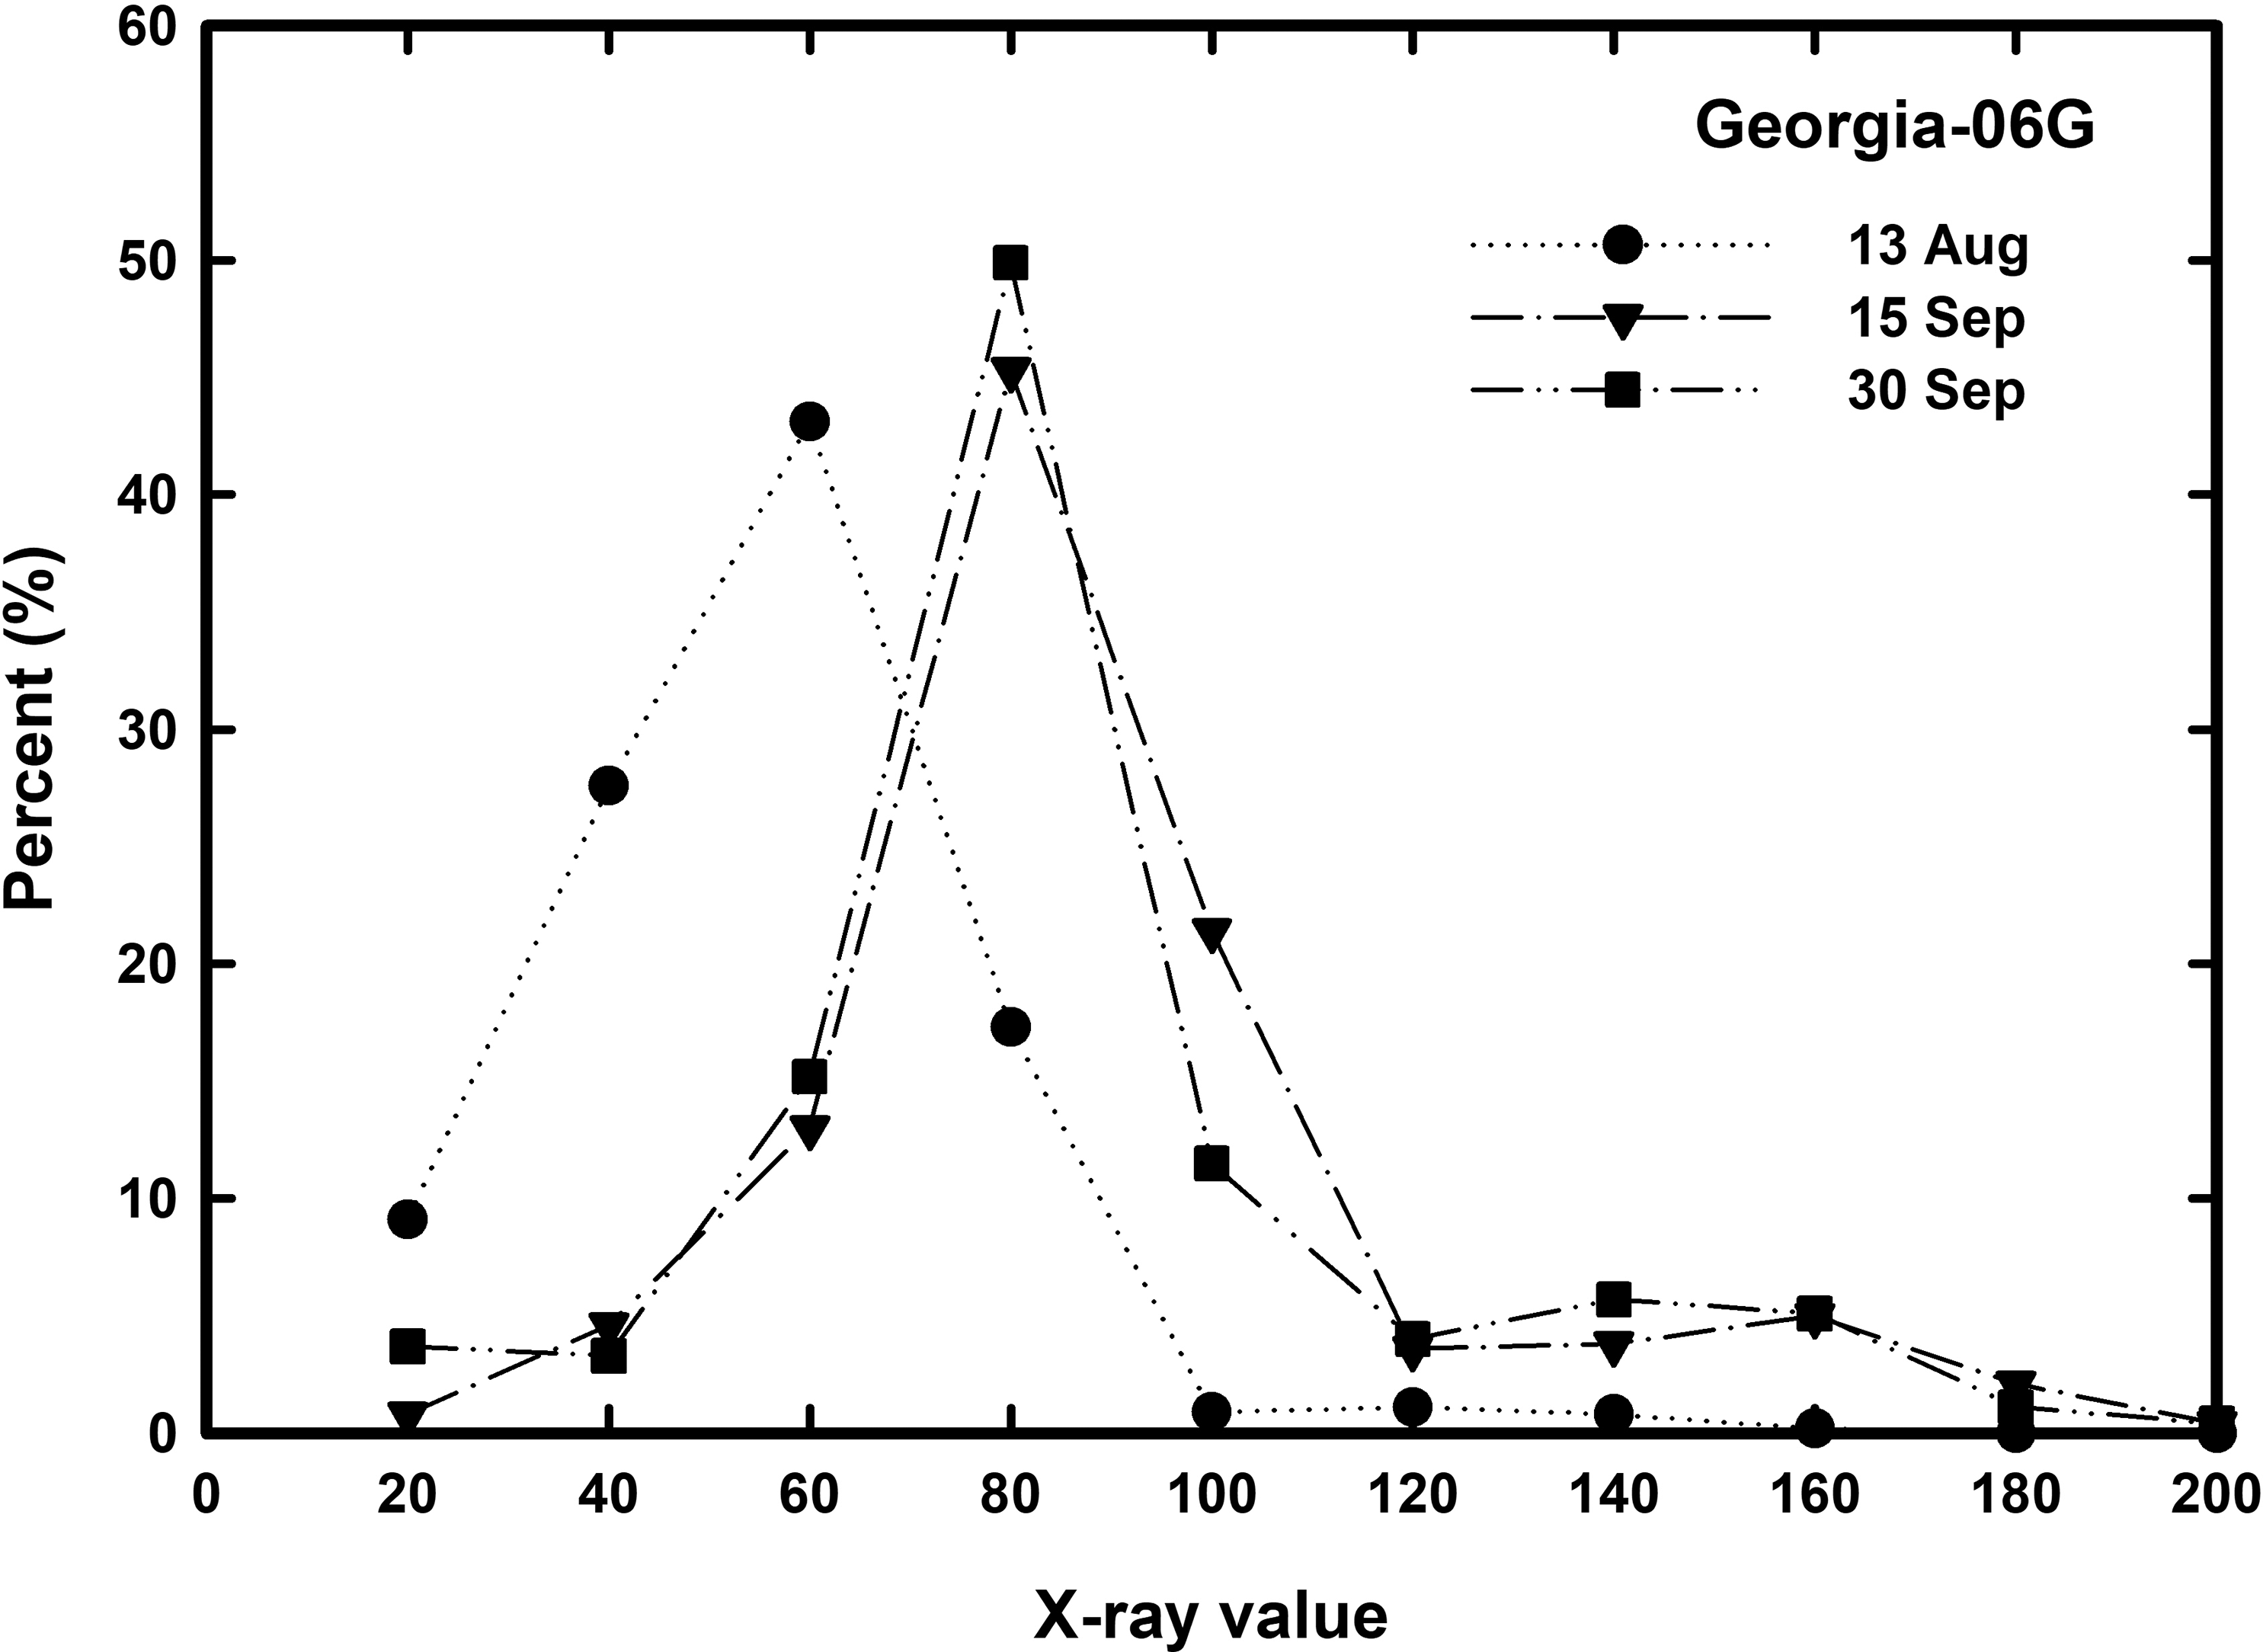
The relationship of the percentage of peanuts (Georgia 06G) by color class versus the range of x-ray values (0 to 20, 20 to 30,...) by three sample dates 13 August, 15, and 30 September.
Summary and Conclusions
X-ray technology has been an accepted practice for many years in food processing, pharmaceuticals, and manufacturing industry for contaminates detection, inspection, counting, material integrity, and damaged products. With the proprietary x-ray system currently used at the National Peanut Research Laboratory, the peanut pods must be dried in order to get a proper measurement. The ability of the x-ray to effectively measure kernel maturity of freshly dug peanuts was not valid probably due to the high moisture content of the kernel and the kernel pressing next to the pod hull so as not to distinguish hull versus peanut. However, once pods were dried, values were acceptable and showed a linear relationship of profile maturity to x-ray value from the white class to the orange class then was flat through the brown and black classes. Both runner type cultivars, Georgia-06G and Georgia-13M, were similar with this linear response to maturity. Both virginia (Georgia-11J) and spanish (AT9899) market types showed the same linear response but at significantly greater and lesser values than the runner market types, respectively.
It must be noted that the algorythms and final x-ray values determined by this proprietray x-ray equipment may not be transferable to other x-ray machines as algorithms take into account machine specifics such as; x-ray power, detector precision, subtract out specific background color, and other machine electronic nuances that are specific to this model.
Overall, the use of x-ray to determine peanut maturity seems to be a valid technique. This research shows that x-ray technology could be used to identify peanut maturity compared with the hull scrape method up to a specific maturity depending on peanut market type. Further research will be needed to identify relationships between kernel maturity and possible digging date.
Literature Cited
D., Boldor, T.H Sanders, K.R Swartzel, and J Simunovic (2002). Computer-assisted color classification of peanut pods. Peanut Sci 29: 41ndash; 46.
W.D Branch, (2007). Registration of 'Georgia-06G' peanut. J. Plant Registrations 1: 120.
Branch, W.D 2012 Registration of 'Georgia-11J' peanut J. Plant Registrations 6: 281- 283, doi:103198/jpr2011.11.0604crc.
Branch, W.D 2014 Registration of 'Georgia-13M' peanut J. Plant Registrations 8: 253- 256, doi:103198/jpr2013.11.0071crc.
J.W Chapin, and J.S Thomas (2005). Effect of fungicide treatments, pod maturity, and pod health on peanut peg strength. Peanut Sci 32: 119- 125.
B.C., Colvin, D.L Rowland, J.A Ferrell, and W.H Faircloth (2014). Development of a digital analysis system to evaluate peanut maturity. Peanut Sci 41: 8- 16.
C.C., Grimm, E.T Champagne, and T.H Sanders (1998). Determination of peanut maturity using a hunter colorimeter. Peanut Sci 25: 99- 103.
Haff, R.P., T.C Pearson, and E. S Jackson 2013 One Dimensional Linescan X-ray Detection of Pits in Fresh Cherries American Journal of Agricultural Science and Technology 1: 18- 26 doi:10.7726/ajast.2013.1002
T.C., Pearson, J.R Prasifka, D.L Brabec, R.P Haff, B.S Hulke (2014). Automated detection of insect-damaged sunflower seeds by X-ray imaging. Applied Engineering in Agriculture 30 ((1)): 125- 131.
D.L., Rowland, R.B Sorensen, C.L Butts, and W.H Faircloth (2006). Determination of maturity and degree day indices and their success in predicting peanut maturity. Peanut Sci 33: 125- 136.
Sanders, T.H., J.A Lansden, R.L Greene, J.S Drexler, and E.J Williams 1982 a Oil characteristics of peanut fruit separated by a nondestructive maturity classification method. Peanut Sci 9: 20_ 23.
Sanders, T.H., A.M Schubert, and H.E Pattee 1982 b Maturity methodology and postharvest physiology, pp. 624- 654 In H.E Pattee and C.T Young (eds.) Peanut Science and Technology Amer. Peanut Res. Educ. Society., Inc Yoakum, TX, USA.
Sanders, T.H., E.J Williams, A.M Schubert, and H.E Pattee 1980 Peanut maturity method evaluations. I. Southeast. Peanut Sci 7: 78- 82.
Sorensen, R.B., Lamb, M.C., and Butts, C.L 2015 Can peg strength be used as a predictor for pod maturity and peanut yield? Peanut Sci 42 (2): 92- 99 (doi:10.3146/0095-3679-42.2.92)
USDA-ARS 1993 Milled peanuts: Inspection instructions USDA, Agricultural Marketing Service, Fruit and Vegetable Division, Washington, DC.
Notes
- Research Agronomist, Agricultural Engineer, and Research Economist, USDA-ARS National Peanut Research Laboratory, P.O. Box 509, 1011 Forrester Dr. SE, Dawson, GA 39842 [^] *Corresponding author's E-mail: ron.sorensen@usda.gov
Mention of proprietary product or company is included for the reader's convenience and does not imply any endorsement or preferential treatment by the USDA-ARS.
Author Affiliations