

Introduction
It has become increasingly apparent that crop maturity in seed peanut (Arachis hypogaea L.) should be a priority for the peanut industry (Carter, 2015). Cultural practices that influence reproductive growth can affect the maturity profile and seed peanut quality. Lamb et al. (2017) noted that timely applications of glyphosate and diflufenzopyr advanced the maturity profile of peanut via late-season flower abortion. Similarly, foliar fertilization may impact timeliness and viability of flowers, pegs, and pods, and may be expected to impact crop maturity.
Growers often apply foliar nutrients to improve overall peanut crop performance and yield. Claimed benefits of peanut foliar fertilizer products include increased number of pegs and pods, overall improved plant health, and improved yield and grade (Peg Power, Triangle Chemical Sycamore, GA), though these claims have not been validated by peer-reviewed research. Previous research on foliar fertilizer in peanut using a nitrogen (N), phosphorus (P), potassium (K), sulphur (S) solution did not provide significant yield increases (Halevy et al., 1987; Walker et al., 1982). These results are similar for other crops. For example, soybean (Glycine max (L.) Merr.) yield response to foliar fertilizer has been inconsistent, showing both increases and decreases (Garcia and Hanway, 1976; Moreira et al., 2017; Poole et al., 1983). Although foliar fertilizers can be tank-mixed with fungicides, the added product cost represents an additional economic input for the grower.
Peanut maturity is assessed by many growers using color classification of the mesocarp with the aid of a color board developed by Williams and Drexler (1981). Near maturity, samples of pods are collected for mesocarp color assessment typically resulting in a Gaussian distribution with varying amplitude (Carter et al., 2017). Anecdotal reports from the field suggest that application of foliar fertilizers promote the overall maturity progress of the crop (D. Anthony Drew, personal communication), thus advancing pods towards the more mature classes in a shorter time frame. Such reports require research to either support or refute these observations. If validated, accelerated crop maturity could aid growers by providing management options for harvest timing control. If refuted, growers could save the added cost of foliar fertilizer applications.
Foliar fertilization of peanut is a common practice in the Southeastern United States. One of the most common foliar applied nutrient is N, which is important for many different plant constituents and processes, including photosynthesis since N is a component of chlorophyll and protein molecules (Bryson and Mills, 2014). Phosphorus although not commonly applied as a foliar fertilizer, is essential for the synthesis of ATP (Bryson and Mills, 2014). Foliar fertilization of boron (B) promotes cell wall structure and prevents "hollow heart" of peanut (Hänsch and Mendel, 2009). Martens and Westermann (1991) reported soil B to be deficient in 43 states of the U.S., and B is commonly deficient in sandy soils where peanut is grown. Nutrient deficiency in general is often due to soil factors such as low-organic matter, soil pH, soil texture and excessive rainfall leading to nutrient leaching. Although the mechanism by which foliar fertilization may lead to increased maturity is unclear, it has been suggested that foliar fertilization may increase photosynthate production via improved leaf tissue nutrient status, thereby increasing flowering, reproductive viability, and pegging (Hardy and Havelka, 1977). To directly manipulate peanut maturity rate, N, P, and B would be likely targets as effectors in seed development and plant allocation to seed filling. For peanut, foliar fertilizer could be particularly important during early reproductive growth when N and P absorption can lag behind plant requirements (Garcia and Hanway, 1976). Thus, early season applications timed around early flowering are likely to have the greatest probability of altering peanut maturity advancement.
The maturity development of peanut can be monitored using the adjusted growing degree d model (aGDD), which consists of adding the seasonal cumulative water received to the Mills (1964) degree d model (Rowland et al., 2006). To address these questions regarding foliar fertilization effects on peanut maturity, a multi-year and location test was conducted, with the hypothesis that foliar fertilization would amplify pod maturation and increase the proportion of mature pods compared to non-foliar fertilized peanut. The objectives of this research were to determine the effects of foliar N, P, and B applications during early flowering on yield and the maturity profile of peanut.
Materials and Methods
Site Description
The experiment was conducted during 2016 and 2017 at the West Florida Research and Education Center near Jay, FL (30°46'32.5"N 87°08'13.5"W, 62 m above sea level) on a Red Bay sandy loam (0-2% slope, fine-loamy, kaolinitic, thermic Rhodic Kandiudults) and one yr (2016) at the Plant Science Research and Education Unit near Citra, FL (29°24'28.9"N 82°08'43.4"W, 21 masl) on a Candler sand (0-5% slopes, hyperthermic, uncoated Lamellic Quartzipsamments) for three site-yrs.
Experimental Design
Cultural practices were consistent with local production recommendations (Wright et al. 2016) with modifications as described below. All fields were fertilized and limed prior to planting according to soil test recommendations. Plots consisted of eight rows spaced 0.9 m apart and 7.6 m long. The experiments were planted on 27 and 10 May for 2016 and 2017, respectively. The experiments were strip-tilled into rye (Secale cereal L.) residue at Jay, FL and triticale (Triticosecale spp.) residue at Citra, FL. Seed of the peanut cultivar, Georgia-06G (Branch, 2007), was treated with azoxystrobin, fludioxonil, and mefenozam (Dynasty, Syngenta, North Carolina USA) as a fungicidal seed treatment. Final peanut stands were six plants per 0.31 m-row. Gypsum was applied at 2242 kg/ha 40 d after planting (DAP). Weeds were controlled as needed, avoiding the use of paraquat dichloride in order to obviate foliar damage and potentially affect foliar fertilizer uptake. Sites were irrigated as needed using overhead lateral irrigation.
A four (foliar fertilization) by two (digging date) factorial experiment was employed using a randomized complete block design with four replications. The two digging dates were approximately 2200 and 2500 aGDD, tracked using the aGDD model, representing early and optimal digging dates (Colvin et al., 2014; Rowland et al., 2006).
Foliar Fertilizer Treatments Applications
Foliar fertilization treatments were 10.0 kg N/ha as urea, 1.0 kg P2O5/ha as triple super phosphate (TSP), 0.34 kg B/ha (Max-In® Boron, Winfield Solutions, LLC, St. Paul, MN) during each application and a control. A low rate of N was applied in order to avoid leaf tissue damage (Nicoulaud and Bloom, 1996), though at the rate applied in this study, some leaf burn was observed at times. Applications were made twice during the season, one at R1 and again two wks later at R2 (Boote, 1982), corresponding to maximum nutrient uptake during early reproductive growth (Garcia and Hanway, 1976). Foliar fertilizer treatments were applied using an eight-row sprayer fitted with Cone-Jet TXVS-18 nozzles (Cone-Jet®, TeeJet Technologies, Spraying Systems Co., Wheaton, IL) at 187 L/ha (Bi and Scagel, 2007; Halevy et al., 1987). The first foliar application was made at R1 approximately 40 DAP (or 750 aGDD) and the second application at R2, two wks later (approximately 1000 aGDD). In 2016, foliar applications occurred on July 7 and 26 at Jay, FL. The one-wk delay in the second application during this site-year was necessitated by 85 mm precipitation between july 20th to 22nd 2016. Citra, FL applications were made on July 12th and 25th 2016. In 2017, applications were made on June 27th and July 12th in Jay, FL. Twenty-four hr after each foliar application, 25 leaf tissue samples were collected randomly in the middle two rows to quantify leaf tissue nutrient status. Leaf tissue samples consisted of leaflets and the petiole from second nodal leaves on the apex stem in a representative area in each plot. The leaves were washed, dried and ground using a Cyclone Lab Sample Mill (UDY Corporation, Fort Collins, Co) to pass a 1 mm sieve. Leaf tissue nutrient concentration was determined using a peroxide digestion followed by inductively coupled plasma mass spectrometry (Beauchemin, 2006).
Canopy Growth
During both years in Jay, normalized difference vegetation index (NDVI) was measured periodically throughout the experiment. NDVI is the amount of near-infrared and red light reflected by vegetation and is derived from the red near-infrared reflectance ratio (Pettorelli et al., 2005) and is often considered as being indicative of plant canopy photosynthetic area (Thelen et al., 2004). NDVI data were recorded weekly using a GeoScout GLS-400 (Holland Scientific Inc, Lincoln, NE) prior to first flower until after canopy closure. The sensor was placed approximately 60 cm over the canopy while walking through the experimental treatments. NDVI data were not recorded in Citra.
Harvest
Digging dates were monitored using aGDD models (Anonymous 2013; Colvin et al., 2014; Rowland et al., 2006). Harvest treatments were targeted for 2200 and 2500 aGDD, representing early and optimal harvest timings, respectively (Rowland et al., 2006). The digging dates at Jay, FL in 2016 were 2184 aGDD (or 112 DAP, considered early) and 2504 aGDD (or 130 DAP, considered optimal), and in 2017, 2326 aGDD (or 117 DAP, considered early) and 2497 aGDD (or 132 DAP, considered optimal). The digging dates in Citra, FL during 2016 were 2430 aGDD (or 126 DAP, considered optimal) and 2650 aGDD (or 137 DAP, considered past optimal). The delay in digging dates at Citra were caused by 52 mm precipitation from Sept 12th to 15th 2016.
The four middle rows of the eight-row plots were dug using a four-row digger creating two windrows. One windrow was used to determine the percent mature pods and the second windrow was used to determine yield. To determine the percentage of mature pods, immediately after digging, all pods were removed from sampled plants until 180 to 220 pods were collected. Pods were blasted using a pressure washer with a turbo nozzle to remove the exocarp and expose the mesocarp color (Carter et al., 2017). The maturity profile was determined using two methodologies described below. One classified pods as mature and immature based on the mesocarp color using a peanut profile board (Carter et al., 2017; Williams and Drexler, 1981). Brown and black pods were considered mature. White, yellow, and orange pods were not used for analysis to ensure only the most mature pods were considered in maturity evaluations. The second method scanned blasted pods on a digital scanner (HP OfficeJet 7612, Palo Alto, CA). The resulting images were analyzed using the PeanutFARM (Anonymous 2013) tool to quantify the percentage of brown/black (mature) pods (Colvin et al., 2014). Peanut pod yield was recorded using the second windrow, approximately one wk after digging, using a plot combine. Final yield data were adjusted to 10% moisture.
Statistical Analysis
Repeated measures analysis of variance for a randomized complete block was conducted for leaf tissue nutrient, NDVI, and yield data using the PROC MIXED procedure in SAS (Version 9.4, SAS Institute Inc., 2017) at 95% confidence level unless otherwise indicated. Individual analyses were performed for each site-year. For leaf tissue nutrient analyses, foliar fertilizer and application time were considered fixed effects. For yield analyses, foliar fertilizer and harvest time were considered fixed effects. NDVI analyses considered foliar fertilizer and time of observation as fixed effects. In all cases, replication and its interactions were considered random effects. Pairwise least square means were separated using least significant differences (LSD) at the 95% confidence level with the %PDMIX800 macro (Saxton, 1998) within SAS 9.4. Figures were generated using R software version 3.6.0 (R Core Team, 2019).
Results and Discussion
Canopy Growth
NDVI values did not differ among foliar fertilizer treatments (data not shown), indicating very little effect of added nutrients on canopy condition. However, NDVI is most effective at detecting nutrient impacts when deficiencies are present. For example, nutrient deficiencies have been detected by NDVI measurement of crops such as soybean and corn (Zea mays L.) (Milton, et al., 1991; Osborne, et al., 2002; Thenkabail, et al., 2000). The lack of differences in NDVI values in the present study indicate that nutrient deficiencies were likely not present so that foliar fertilization had little relative impact on plant nutrient status (Bryson and Mills, 2014). NDVI did differ by aGDD as the crop developed, a common result in other studies since NDVI increases with leaf area index as the crop matures (Elvidge and Chen, 1995; Huete et al., 1985).
Foliar Tissue Nutrient Concentrations
Even though foliar fertilization did not affect NDVI, direct measures of leaf tissue N concentrations were affected by fertilization treatments (Table 1). Compared to the control, leaf tissue N measured 24 hr after foliar N application increased during two of three site-years. The lack of consistent response in leaf tissue N concentration may be due to the relatively quick translocation of N from leaves to fruits (Wittwer et al., 1963). Uptake and translocation toward the developing seed may have already occurred when the leaves were sampled 24 hr after application, particularly given the relatively low amount of foliar N applied.
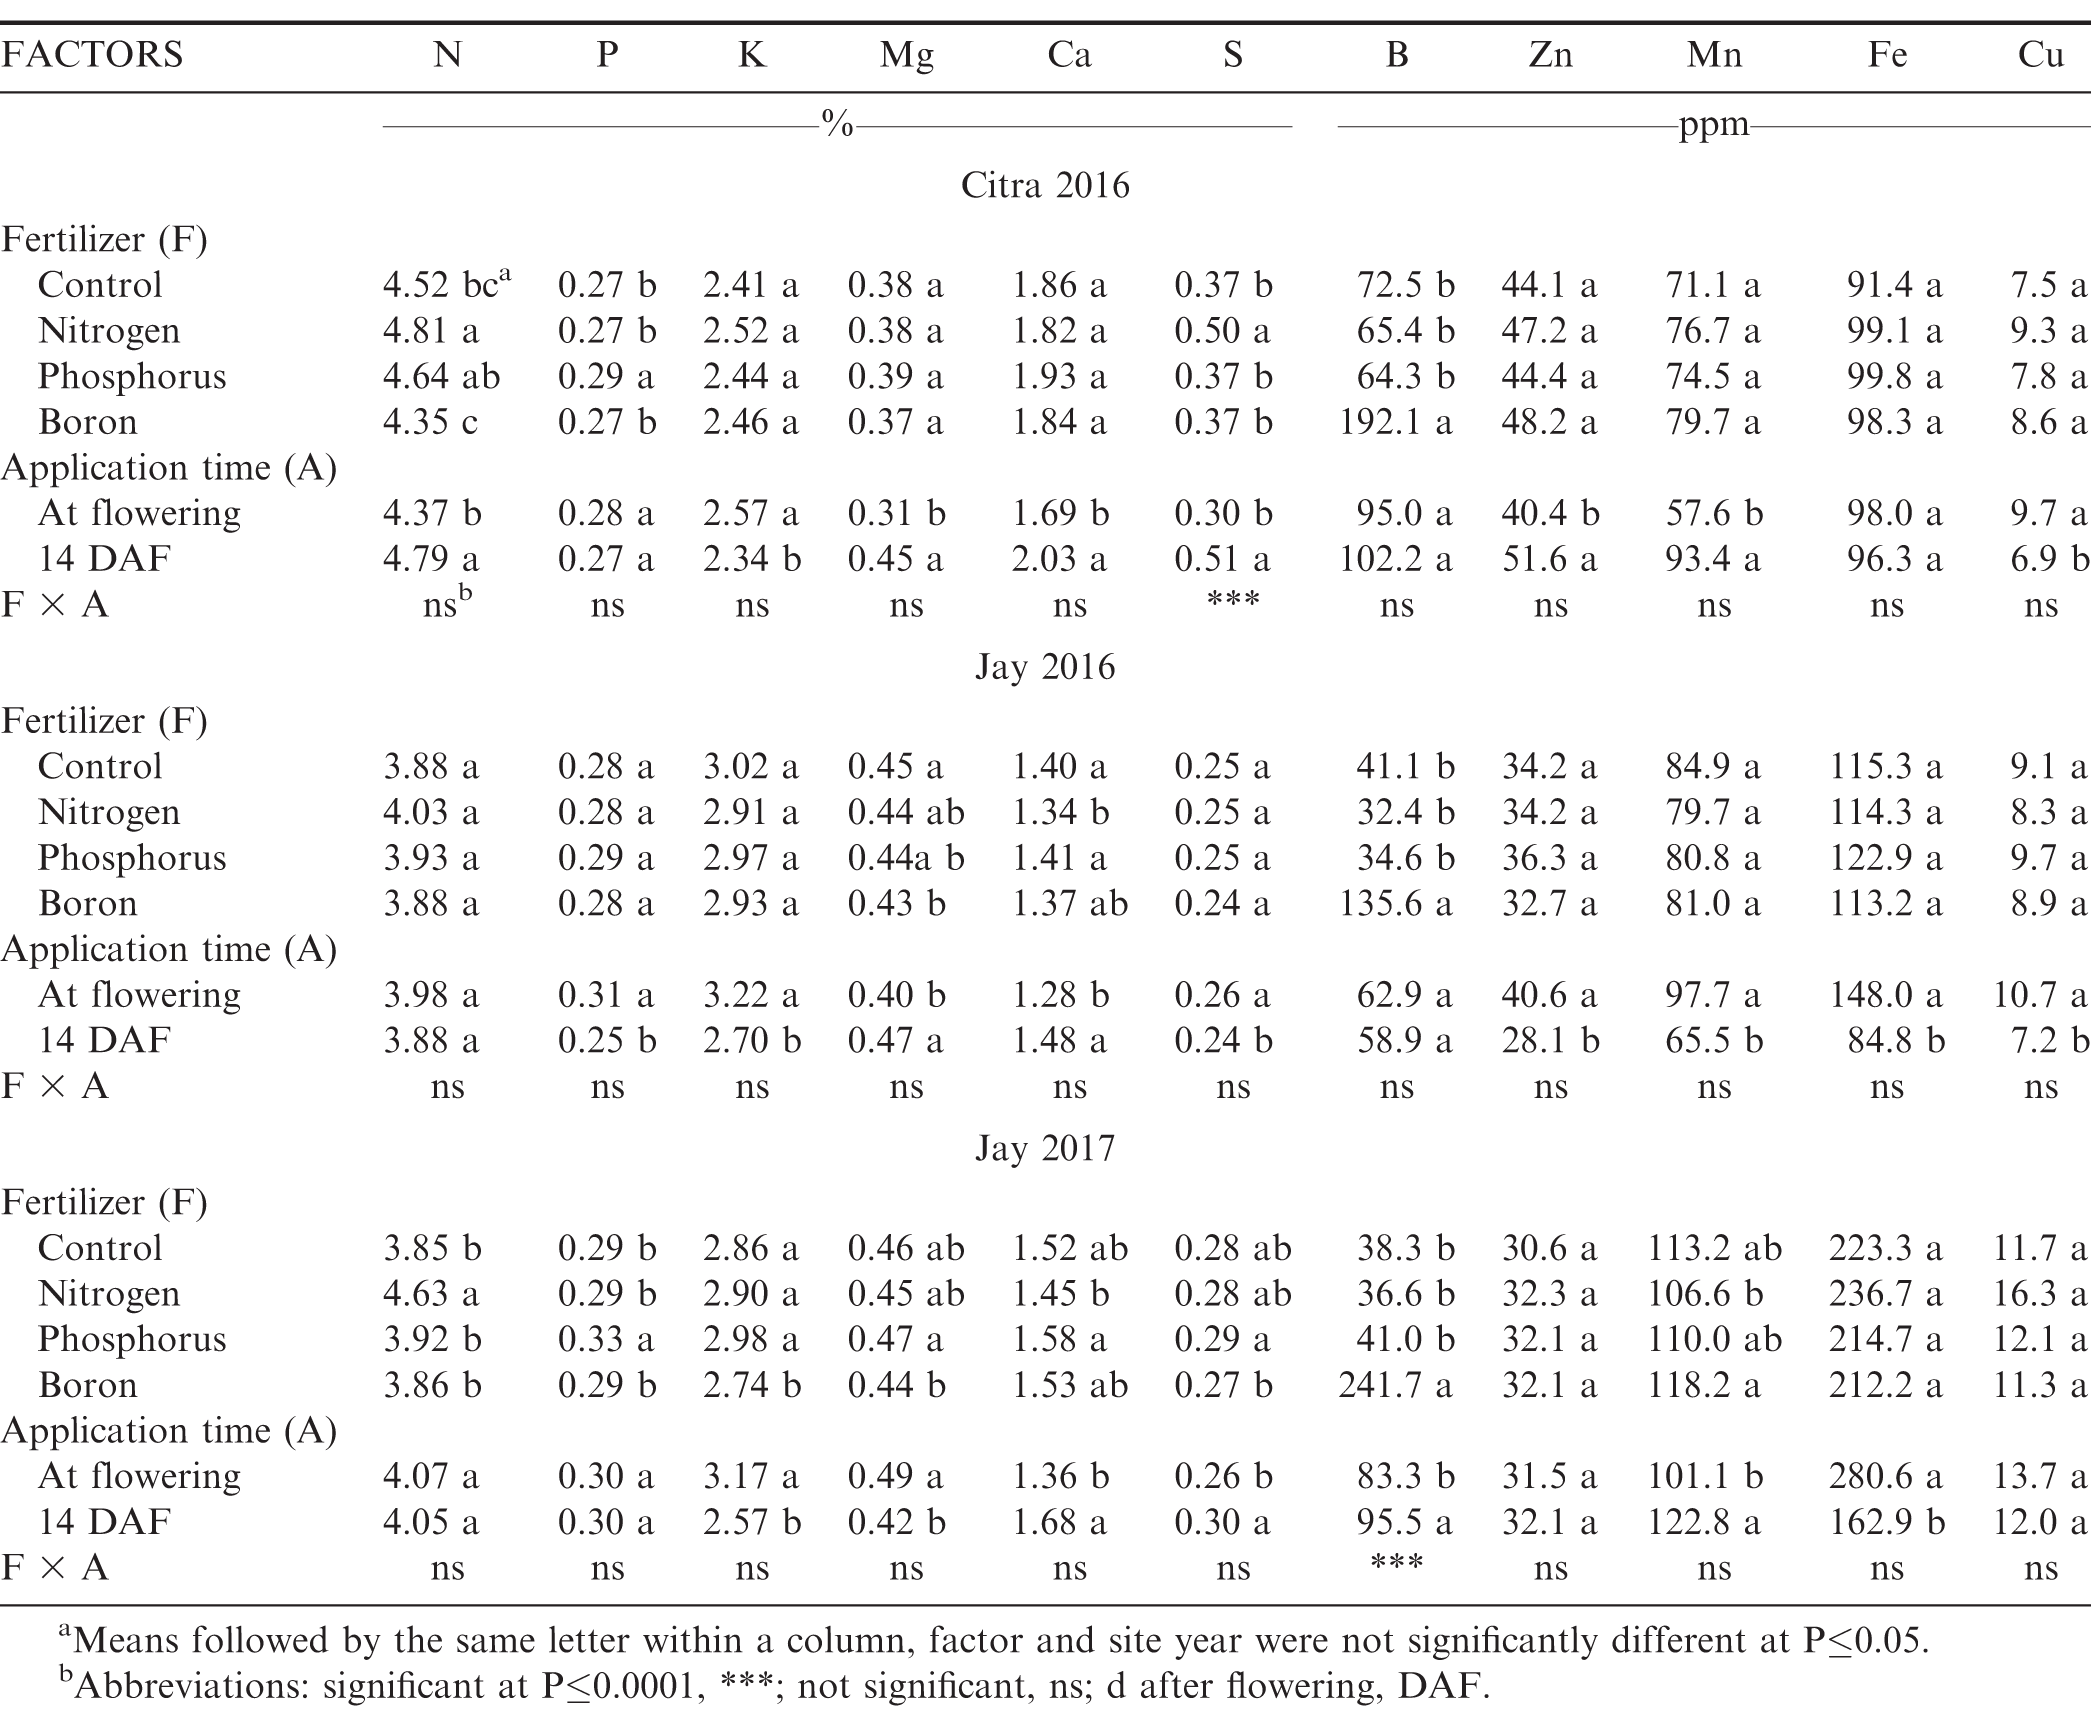
Elemental leaf tissue analysis after two foliar fertilizer applications to peanut in Florida; three site years (Citra 2016, Jay 2016 and Jay 2017).
After foliar P application, leaf P concentration increased during two of three site-years compared to the control (Table 1). These results are somewhat more consistent than those reported by Walker et al. (1982), who generally noted no leaf tissue P response after foliar P application, even at rates up to 5.8 kg P/ha. However, that study sampled tissue 10 to 14 d after application and every 28 d thereafter, whereas the current study sampled tissue 24 hr after application. The shorter interval between application and sampling may explain the greater tissue P response compared to the control in the present study.
Boron fertilization consistently resulted in an increase in leaf tissue B concentration compared to the control (Table 1) in Jay and Citra after each application. The high tissue B concentrations indicated the nutrient was absorbed by the leaf. Konsaeng et al. (2010) reported that upper foliar B concentration decreased with time concomitant with an increase in lower foliage B concentration, demonstrating a remobilization of B during a 13-d span.
Yield and Maturity Profile
In 2016 at Citra, FL, yield was not affected by foliar treatment (Figure 1). This location was harvested at optimum maturity (2430 aGDD, or 126 DAP) and 150 aGDD past-optimum (at 2650 aGDD, or 137 DAP), though it bears noting that 137 DAP would be considered within the optimal harvest range by most growers. Furthermore, Georgia-06G is a medium maturity genotype, considered ready for harvest at 135 to 140 DAP (Branch, 2007; Branch and Brenneman, 2009). The 2016 Jay, FL site was harvested at both an early (2184 aGDD, or 112 DAP) and optimum digging date (2504 aGDD, or 130 DAP), resulting in lower yield during the earliest harvest date (p=0.0004, Figure 1). Yield increased by 560 kg/ha during the early digging date in Jay when foliar P was applied compared to the control, but this effect was significant only during one of the three site-yrs. Foliar applications of B or N did not increase yield at any digging date, nor did P application when peanut was dug during an optimal time. In 2017, yield was lower (Figure 1) at the early harvest date (2326 aGDD, or 117 DAP) compared to the later harvest (2497 aGDD, or 132 DAP). During both harvest timings, foliar treatments did not affect yield.
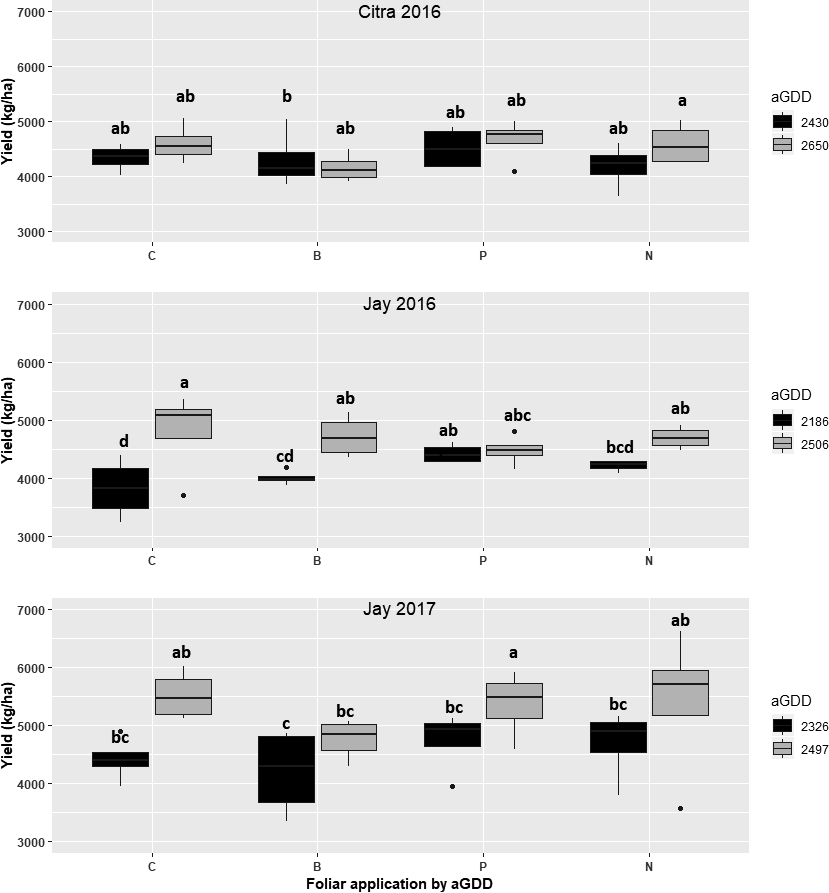
Peanut yield as affected by two harvest timings based on adjusted growing degree d (aGDD) and four foliar fertilizer treatments at Citra (2016) and Jay (2016 and 2017). Abbreviations: C=control; N=10 kg N/ha; P=1.0 kg P2O5/ha; B=0.3 kg B/ha; all split-applied during the season at first flower and again approximately two wk later. Different letters represent different means at P<0.05 (LSD). Black bars represent early harvest timing and gray bars represent optimal harvest timing.
Within harvest date, the percentage of mature pods was not generally affected by foliar fertilization treatments during any site-year using both methodologies (Figure 2), except for boron foliar fertilizer which increased the percentage of mature kernels assessed by profile board during the second digging date in Jay 2016. As expected, the percentage of mature pods increased when pods were dug at optimal timing compared to early digging, except in 2017 using the digital imaging method. Maturity assessment using the profile board showed more variation than the digital imaging method, likely because immature pods can often be smaller than mature pods. Results from this study did not support the hypothesis that foliar fertilization affects the peanut maturity profile under these conditions. However, foliar fertilizers might influence the maturity profile of peanut, under nutrient limiting conditions.
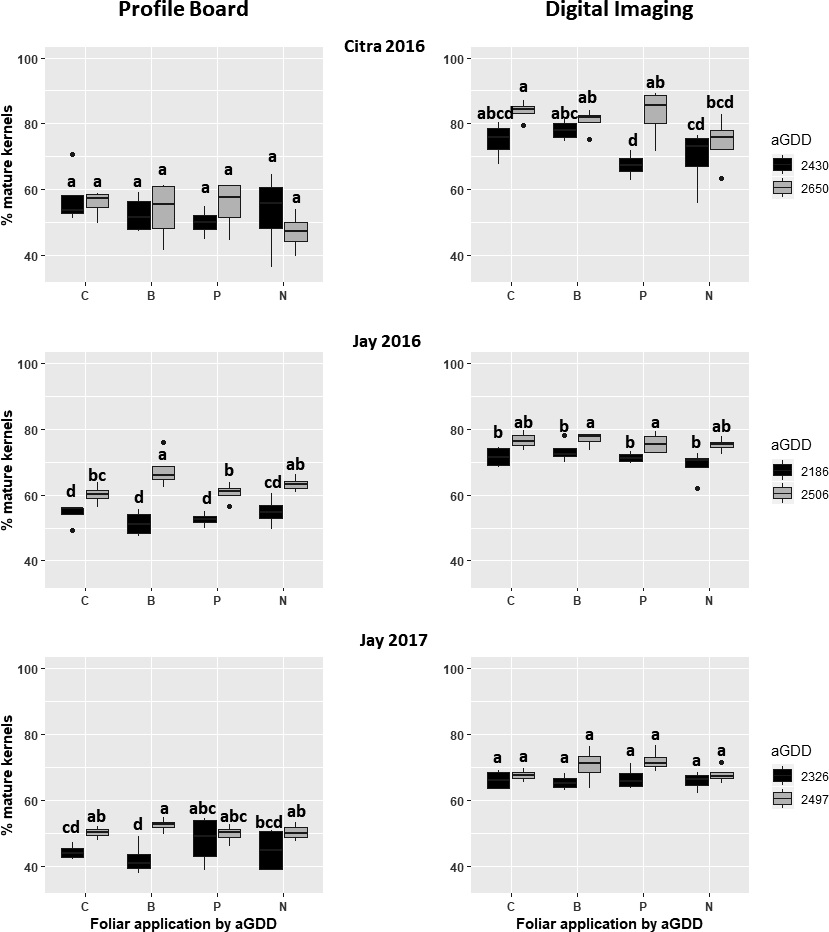
Percentage of mature kernels between two harvest timings based on adjusted growing degree d (aGDD) and foliar fertilizer applications using the peanut profile board (left) and digital imaging (right) at Citra (2016) and Jay (2016 and 2017). Abbreviations: C=control; N=10 kg N/ha; P=1.0 kg P2O5/ha; B=0.3 kg B/ha: all split-applied during the season at first flower and again approximately two wk later. Different letters represent different means at P<0.05 (LSD). Black bars represent early harvest timing and gray bars represent optimal harvest timing.
Conclusions
Foliar applications did not improve maturity when digging early at any site-year using the profile board. Compared to the control, B application increased the percentage of mature pods during one of three site-years (Jay 2016) during the second digging date when assessed using the profile board. When the digital imaging model was used to assess maturity, no foliar application increased maturity, and there was a significant decrease in the percent mature pods at one site-year (Citra 2016) when foliar N was applied and dug at the second digging date. Though an increase in B leaf tissue concentration one d after foliar applications was observed, it did not affect growth, yield or maturity. Foliar P applications increased yield by 560 kg/ha when pods were dug early in one site-year, but the result did not affect peanut maturity. The maturity profile of peanut was generally not affected by foliar fertilization with N, P or B under the conditions of this experiment.
Acknowledgements
This work was supported in part by the Florida Peanut Producers Association and by the USDA National Institute of Food and Agriculture Hatch project FLA-JAY-005475. The UF/IFAS Statistical Consulting Unit assisted with analyses. We thank the staff and graduate students of the UF/IFAS West Florida Research and Education Center and the UF/IFAS Plant Science Research and Education Unit for help with crop maintenance and data collection. The authors would particularly like to thank Moo Brown, Porcha Phillips, Randy Dozier and James Boyer for their assistance with this work.
Literature Cited
Anonymous 2013 PeanutFARM online at http://peanutfarm.org/ Accessed July 26th 2019.
D Beauchemin, (2006). Inductively coupled plasma mass spectrometry. Analytical Chemistry 82: 4786- 4810.
G Bi, and C.F Scagel (2007). Nitrogen foliar feeding has advantages. Nursery Management & Production, : 42- 46.
K Boote, (1982). Growth stages of peanut (Arachis hypogaea L.). Peanut Science 9: 35- 40.
W Branch, (2007). Registration of 'Georgia-06G'peanut. Journal of Plant Registrations 1: 120- 120.
W Branch, and T Brenneman (2009). Field evaluation for the combination of white mould and tomato spotted wilt disease resistance among peanut genotypes. Crop Protection 28: 595- 598.
Bryson, G.M and H.A Mills 2014 Plant analysis handbook IV: a guide to plant nutrition and interpretation of plant analysis for agronomic and horticultural crops Micro-Macro Publishing, Athens, GA.
E Carter, (2015). An analysis of the physiological impacts on life history traits of peanut (Arachis hypogaeal L.) maturity classes in a field setting (unpublished). University of Florida. .
E., Carter, D Rowland, B Tillman, J Erickson, T Grey, J Gillett-Kaufman, et al (2017). Pod maturity in the shelling process. Peanut Science 44: 26- 34.
B., Colvin, D Rowland, J Ferrelland W Faircloth (2014). Development of a digital analysis system to evaluate peanut maturity. Peanut Science 41: 8- 16.
C.D Elvidge, and Z Chen (1995). Comparison of broad-band and narrow-band red and near-infrared vegetation indices. Remote Sensing of Environment 54: 38- 48.
L Garcia, and J.J Hanway (1976). Foliar fertilization of soybeans during the seed-filling period. Agronomy Journal 68: 653- 657.
J., Halevy, A Hartzookand T Markovitz (1987). Foliar fertilization of high-yielding peanuts during the pod-filling period. Fertilizer Research 14: 153- 160.
R Hänsch, and R.R Mendel (2009). Physiological functions of mineral micronutrients (Cu, Zn, Mn, Fe, Ni, Mo, B, Cl). Current Opinion in Plant Biology 12: 259- 266.
R Hardy, and U Havelka (1977). Possible routes to increase the conversion of solar energy to food and feed by grain legumes and cereal grains (crop production): CO 2 and N 2 fixation, foliar fertilization, and assimilate partitioning. Biological Solar Energy Conversion, : 299- 322.
A., Huete, R Jacksonand D Post (1985). Spectral response of a plant canopy with different soil backgrounds. Remote Sensing of Environment 17: 37- 53.
S., Konsaeng, B Delland B Rerkasem (2010). Boron mobility in peanut (Arachis hypogaea L.). Plant and Soil 330: 281- 289.
Kuepper, G 2003 Foliar fertilization ATTRA Publication.
M., Lamb, R.B Sorensen, C.L Butts, P.M Dang, C.Y Chenand R.S Arias (2017). Chemical interruption of late season flowering to improve harvested peanut maturity. Peanut Science 44: 60- 65.
D Martens, and D Westermann (1991). Fertilizer application for correcting micronutrient deficiencies. Crop Protection, .
W Mills, (1964). Heat unit system for predicting optimum peanut-harvesting time. Transactions of the ASAE 7: 307- 0309.
N., Milton, B Eiswerthand C Ager (1991). Effect of phosphorus deficiency on spectral reflectance and morphology of soybean plants. Remote Sensing of Environment 36: 121- 127.
A., Moreira, L Moraes, G Schroth, F Beckerand J Mandarino (2017). Soybean yield and nutritional status response to nitrogen sources and rates of foliar fertilization. Agronomy Journal 109: 629- 635.
B.A Nicoulaud, and A.J Bloom (1996). Absorption and assimilation of foliarly applied urea in tomato. Journal of the American Society for Horticultural Science 121: 1117- 1121.
S., Osborne, J.S Schepers, D Francisand M.R Schlemmer (2002). Detection of phosphorus and nitrogen deficiencies in corn using spectral radiance measurements. Agronomy Journal 94: 1215- 1221.
Peg Power 2014 Peg power: a unique liquid plant growth fertilizer Triangle Chemical, Macon, GA.
N., Pettorelli, J.O Vik, A Mysterud, J.-M Gaillard, C.J Tuckerand N.C Stenseth (2005). Using the satellite-derived NDVI to assess ecological responses to environmental change. Trends in Ecology & Evolution 20: 503- 510.
W., Poole, G Randalland G Ham (1983). Foliar fertilization of soybeans. I. Effect of fertilizer sources, rates, and frequency of application. Agronomy Journal 75: 195- 200.
R Core Team 2019 R: A Language and Environment for Statistical Computing Vienna: R Foundation for Statistical Computing Available online at: http://www.R-project.org/.
D., Rowland, R Sorensen, C Buttsand W Faircloth (2006). Determination of maturity and degree day indices and their success in predicting peanut maturity. Peanut Science 33: 125- 136.
SAS Institute Inc 2017 The MIXED procedure SAS Institute Inc.
A Saxton, (1998). A macro for converting mean separation output to letter groupings in Proc Mixed. Proc. 23rd SAS Users Group Intl., SAS Institute, Cary, NC: 1243-1246..
K.D., Thelen, A Kravchenkoand C.D Lee (2004). Use of optical remote sensing for detecting herbicide injury in soybean. Weed Technology 18: 292- 297.
P.S., Thenkabail, R.B Smithand E De Pauw (2000). Hyperspectral vegetation indices and their relationships with agricultural crop characteristics. Remote Sensing of Environment 71: 158- 182.
M., Walker, T Gainesand R Henning (1982). Foliar fertilization effects on yield, quality, nutrient uptake, and vegetative characteristics of Florunner peanuts. Peanut Science 9: 53- 57.
E.J Williams, and J.S Drexler (1981). A non-destructive method for determining peanut pod maturity. Peanut Science 8: 134- 141.
S., Wittwer, M Bukovacand H Tukey (1963). Advances in foliar feeding of plant nutrients. Fertilizer Technology and Usage, : 429- 455.
D.L., Wright, B Tillman, I.M Small, J.A Ferrell, and N DuFault (2016). Management and cultural practices for peanuts. The Institue of Food and Agricultural Sciences (IFAS), University of Florida, UF/IFAS EDIS Extension Publication #SS-AGR-74, Accessed online July 15, 2019..
Notes
- Grad. Res. Asst. and Asst. Prof., Agronomy Department, University of Florida, West Florida Research and Education Center, Jay, FL 32565. [^]
- Prof., Agronomy Department, University of Florida, Gainesville, FL 32611. [^]
- Assoc. Prof., Agronomy Department, University of Florida, North Florida Research and Education Center, Marianna, FL, 32446. [^]
- Prof. Department of Crop and Soil Sciences, University of Georgia, Tifton, GA 31793. [^]
- Grad. Res. Asst., Agronomy Department, University of Florida, West Florida Research and Education Center, Jay, FL 32565. [^]
- Asst. Prof., Crop and Soil Sciences, North Carolina State University, Raleigh, NC 27695. [^]
- Grad. Res. Asst., Agricultural and Biological Engineering, University of Florida, Gainesville, FL 32611. [^]
- Prof., Soil and Water Science, University of Florida, West Florida Research and Education Center, Jay, FL 32565. [^] *Corresponding author (m.mulvaney@ufl.edu)
Author Affiliations