

Introduction
Peanut (Arachis hypogaea L.) is the second most economically important legume worldwide after soybean (Glycine max L.) and the fourth most important oilseed crop after soybean, rapeseed (canola, Brassica napus L.), and cottonseed (Gossypium hirsutum L.) (FAOSTAT, 2013). Its high protein, unsaturated fat, carbohydrate, vitamin, and mineral contents make it an important dietary component in many countries, a nutritious snack, and healthy feed or feed additive (APC, 2013, USDA, 2009). Global peanut production area in 2013 was about 26.5 M ha with an annual production of 35.7 MT (USDA, 2013). Around 70% of these production areas are located in arid and semi-arid regions where conditions frequently expose peanuts to drought stresses for varied durations and intensities (Reddy et al., 2003). Since peanut pods grow underground, their development is directly influenced by the water conditions of the surrounding soil (Underwood et al., 1971). As an underground crop, the pods are subjected to continuous risk of direct contact with populations of aflatoxigenic aspergilli in the soil (Horn, 2005).
Aflatoxin contamination in several crops has been repeatedly reported to have adverse effects in livestock and human health. This includes reduced immune system function against infections and diseases, lesser productivity such as reduced milk yield in cattle and decreased egg production in poultry, hepatocellular carcinoma (liver cancer), and death. This consequence has led to significant economic problems for the international peanut trade and high losses to international and domestic producers (Jelinek et al., 1989, Swindale, 1989). Prolonged drought and high soil temperature, with a mean of 27 to 30 C, were identified as the two major factors contributing to enhanced pre-harvest fungal invasion and aflatoxin contamination. This is especially true when stress occurs during the last three to six wk of the growing season (Horn and Pitt, 1997). These two factors are interrelated and neither will lead to increased aflatoxin concentration alone. Moreover, aflatoxin contamination increases as the severity of drought stress increases (Hamidou et al, 2013). Provision of irrigation was shown to mitigate drought stress in plants and reduce aflatoxin contamination (Reddy and Sulochanamma, 2008). Irrigation, however, is not available for most peanut growing areas. The development of drought-resistant genotypes had been viewed as a potential solution (Holbrook et al., 2000).
Early breeding efforts for the selection of drought-tolerant genotypes were based on pod yield alone. High-yielding cultivars that continued to produce well under drought conditions were selected as a priority to enable stable production (Kambiranda et al., 2011). However, the selection of genotypes using pod yield has been slow and has produced highly variable results as yield is affected by large genotype by environment (G × E) interactions (Wright et al., 1996). In response, additional selection criteria, such as water-use efficiency (WUE) (Jongrungklang et al., 2008) and transpiration efficiency (TE) (Nigam et al., 2005), were developed to select genotypes with drought tolerance traits. Although WUE and TE are good indicators of drought tolerance, measurement can be very tedious. Hence, more easily measurable traits, such as those used in this study, were developed and had shown to be good predictors of plant performance under drought (Arunyanark et al., 2010, Nageswara Rao et al., 2001). Several studies reported that certain crop physiological traits which confer drought tolerance may be used as indirect selection criteria for reduced pre-harvest aflatoxin contamination in peanut. The peanut genotypes with drought tolerance traits generally showed lower levels of pre-harvest aflatoxin contamination indicating that they may possess some degree of resistance to aflatoxin contamination (Arunyanark et al., 2010, Holbrook et al., 2000). Furthermore, significant correlations were reported between aflatoxin contamination with visual ratings and leaf temperature (Holbrook et al., 2000), with SPAD chlorophyll meter reading (SCMR) and pod yield (Arunyanark et al., 2010), and with ground-based reflectance (Sullivan and Holbrook, 2007). Considering that drought tolerance is a complex phenomenon that involves many mechanisms (Bartels and Phillipps, 2010), it is useful to use combinations of several traits as selection criteria for drought tolerance rather than a single trait (Puangbut et al., 2011). Therefore in this study, visual ratings, chlorophyll fluorescence, SCMR, canopy temperature (CT), canopy temperature depression (CTD), normalized difference vegetation index (NDVI), and pod yield were used to evaluate drought tolerance traits in seven peanut genotypes. Using a combination of these traits, instead of relying on a single trait, should lead to identification of genotypes with drought tolerance and/or aid in understanding the mechanisms of drought tolerance in peanuts. As the methods were used to evaluate the same set of genotypes, the advantages and disadvantages of using each method were also assessed.
Materials and Methods
Plant materials and trial setup
Rainout shelters were set up at the National Environmentally Sound Production Agriculture Laboratory (NESPAL) (31°28′32.2″N 83°31′46.2″W) and at the Gibbs Farm (31°26′04.7″N 83°35′18.3″W), Tift County, Georgia during the summers of 2012 and 2013. Both locations have Tifton sandy loam soil (fine loamy, kaolinitic, thermic Plintic Kandiudults) composed of 87% sand, 7% silt, 6% clay and <1% organic matter. Seven peanut genotypes, namely: Tifguard (Holbrook et al., 2008), Tifrunner (Holbrook and Culbreath, 2007), C76-16, Florida-07 (Gorbet and Tillman, 2008), accession PI 158839 from the peanut core collection (Holbrook et al., 1993), NC 3033 (Beute et al., 1976) and A72 were provided by the peanut programs of the United States Department of Agriculture - Agricultural Research Service (USDA-ARS) Crop Genetics and Breeding Research in Tifton, GA and University of Georgia (UGA) Tifton Campus. The first six genotypes were tested for drought tolerance and aflatoxin resistance while A72, formerly identified as aflatoxin susceptible, served as the susceptible check.
The NESPAL trial was conducted in 24 two-row field microplots (1.7 m long by 1.4 m wide with 0.9 m spacing in between rows) equipped with an automated rain-out shelter that was manually closed when rain was expected and moved to their original position when rain was unlikely. Each microplot was installed with four soil moisture (model 200SS, Watermark, Riverside, CA) and three temperature (model 200TS, Watermark) sensors at the pod zone (upper soil layer, 28 cm), four soil moisture sensors at the root zone (lower soil layer, 0.5 m), and PVC pipe planting frames (10.2 cm by 27.9 cm by 1.4 m) on each row. A CR3000 Micrologger (Campbell Scientific, Logan, Utah) was used to monitor and collect hourly data from the soil moisture and temperature sensors. The root and pod zones were separated by an elastic rubber sheet (1 mm thick) stretching from the border walls of the microplot to the outer sides of the planting frames. Two-week old peanuts grown in the greenhouse were transplanted in the middle of the planting frames at a final plant density of 20 plants/m row. The peanut roots penetrated into the lower soil layer without entering the pod zone as prevented by the rubber sheet, while the pegs grew and spread over the upper soil layer. The rubber sheet also prevented the movement of water between zones. The experiment was arranged in split-plot design where three water treatments served as the main plot factor and six peanut genotypes (Tifguard, Tifrunner, C76-16, Florida-07, PI 158839, and A72) as the subplot factor. For the first 100 d after planting (DAP), irrigation at field capacity was supplied through drip irrigation at the root zone and manual spray irrigation at the pod zone. Starting at 100 DAP, treatments included: pod-zone stress (PZS) = drought and heat stress at the pod zone, irrigated at the root zone but not at the pod zone; whole plant stress (WPS) = heat stress imposed and no irrigation provided at the pod and root zones; and well-watered (WW) = no heat stress imposed, irrigated at the pod and root zones. There were three replicates per genotype for PZS and WPS and two replicates per genotype for the irrigated plots. Increased soil temperatures were achieved by passing hot water (30 C) through PVC pipes (1.5 cm dia. by 1.3 cm) installed on both sides of each row (12.7 cm from the middle of the row). Irrigation was provided each time water tension reached 200 kPa in order to bring it back to 180 kPa. In 2013, the authors were interested to assess NC 3033 because of its reported drought tolerance characteristics. Since it was observed from the 2012 trial that PI 158839 exhibited high visual drought stress ratings under WPS, low yield and considerably high aflatoxin contamination, PI 158839 was replaced with NC 3033 at the NESPAL shelter for the 2013 trial.
The Gibbs Farm trial in 2012 was arranged in a randomized complete block design with eight replications. Tifguard, Tifrunner, C76-16, Florida-07, PI 158839, and A72 were planted in two-row rectangular plots (1.5 m long by 1.2 m wide with 0.9 m spacing) at a final plant density of 20 plants/m row. For the first 100 d of planting, irrigation (1.9 to 3.8 cm) was provided as needed. The amount of water provided was calculated based on the amount of rainfall received (measured by a rain gauge set-up within the trial) and the water use required by peanuts at certain DAP for Tifton soil series (Harrison, 2012). Whole plant stress was implemented by covering the entire test plots with a mobile greenhouse which remained in place from 100 DAP until harvest. In 2013, the same genotypes were planted under WPS (covered with rainout shelter) and WW (uncovered) conditions. The experiment was arranged in a split-plot design where water treatment served as the main plot factor and genotype as the subplot factor. There were eight replicates per genotype for each water treatment.
Fungal inoculum preparation
The fungal inocula were prepared using the organic matrix method (Will et al. 1994). Briefly, heat-sterilized cracked corn (25% moisture content) was inoculated with spore suspensions of seven-day old cultures of Aspergillus flavus (NRRL 3357) and A. parasiticus (NRRL 2999) containing approximately 1 × 10⁶ conidia/ml of water. The inocula were incubated at 25 C for three d then stored at 4 C until used for field inoculation. These were sprinkled by hand directly on the plant foliage then gently dislodged to the soil surface under the canopy.
Visual rating
Plant drought stress was rated on a scale of 1 to 5 based on the criteria described in Figure 1. The criteria used were as follows: 1 = healthy plants; no symptoms of drought stress; leaves are raised, turgid, green/bright green in color; 2 = upper branches bend downwards; 3 = whole plant bends downwards; leaves start to dry and turn brown; 4 = upper canopy dries up; leaves become brittle and thin; and, 5 = plants are severely wilted and/or (nearly) dead. Ratings were done twice daily (8:00 and 13:00 hr), twice a week. Ratings at the NESPAL shelter were taken on Mon and Thu, and at the Gibbs Farm on Tue and Fri. This allowed a spacing of 3 to 4 d between ratings. Morning ratings were done to assess permanent wilting of the plants while the afternoon ratings were done to assess drought stress as affected by solar heat.
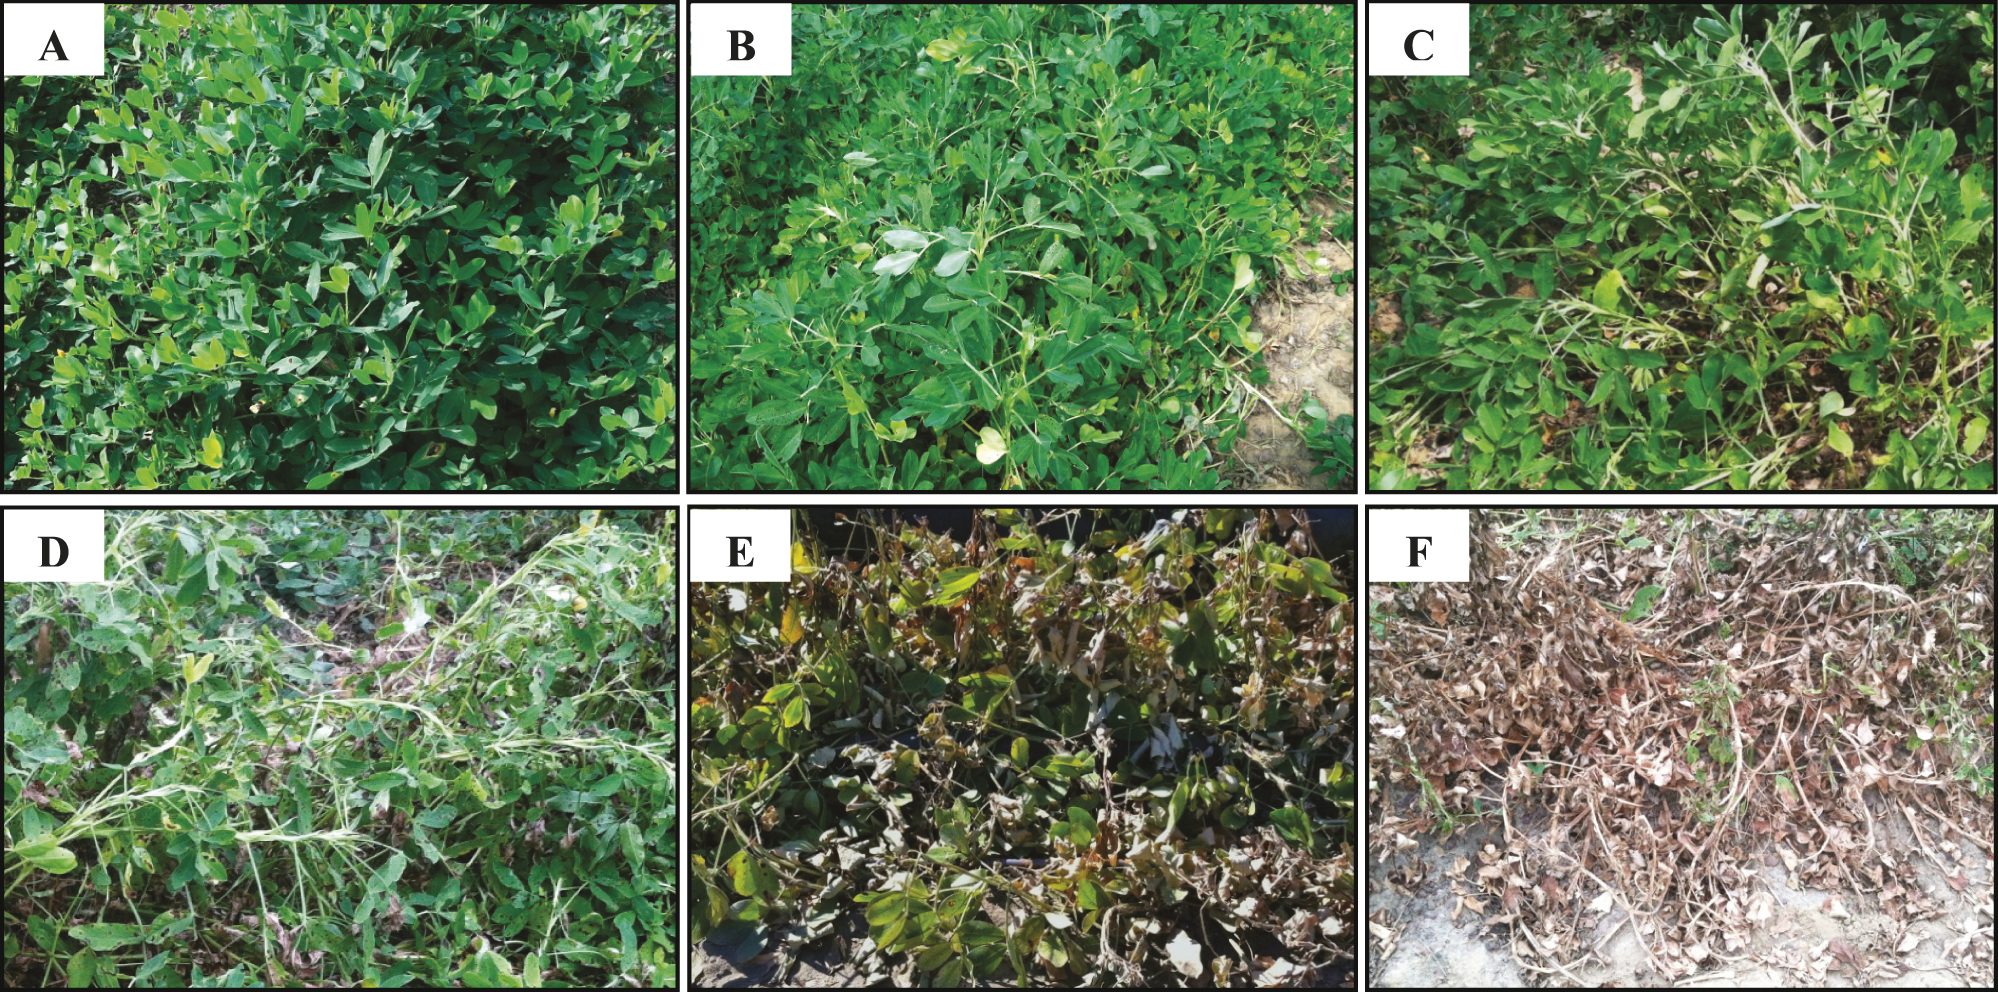
General criteria used for the visual rating of drought stress on a scale ranging from 1‐5, where: 1 = healthy plants; no symptoms of drought stress; leaves are raised, turgid, green/bright green in color (A); 1.5 = top leaves start to fold/curl/wave; leaf color changes to lighter green/yellowish green (some genotypes may not show color change) (B); 2 = upper branches bend downwards (C); 3 = whole plant bends downwards; leaves start to dry and turn brown (D); 4 = upper canopy dries up; leaves become brittle and thin (E); and, 5 = plants are severely wilted and/or (nearly) dead (F).
Chlorophyll fluorescence
Chlorophyll a fluorescence measurements were conducted using a handheld fluorometer (FluorPEN FP 100, Photon System Instrument, Drasov, Czech Republic) by taking fluorescence readings from the second fully-expanded penultimate leaf of the main stem of three randomly selected plants per plot. Readings were taken twice a week (3 to 4 d spacing between ratings) prior to dawn (5:00 to 6:00 hr) to allow dark adaptation of the plants for at least eight hours. Three parameters were reported, namely: performance index (PIABS), quantum yield of electron transport (φEO), and maximum quantum yield of photosystem II (Fv/Fm). All of the aforementioned parameters provide information on the efficiency of primary photosynthetic processes. For an overview of the theory, measurement methods, and calculations associated with each parameter, readers are referred to Appenroth et al., 2001 and Strasser et al., 2000.
SPAD chlorophyll meter reading (SCMR)
Chlorophyll content was measured using a SPAD meter sensor (SPAD-502, Minolta, Tokyo, Japan). Readings were taken from the second fully-expanded penultimate leaf of the main stem (Nageswara Rao et al., 2001) of five randomly selected plants per plot. Care was taken to ensure that the meter sensor fully covered the lamina while avoiding the interference of the veins and midrib of the leaves (Nageswara Rao et al., 2001). Readings were taken in the morning (10:00 hr) twice a week with a spacing of 3 to 4 d between ratings.
Normalized difference vegetation index (NDVI)
Spectral chlorophyll reflectance was measured using a handheld active sensor reflectance meter (Crop Circle model ACS-210, Holland Scientific, Lincoln, NE). Readings were taken over the middle of each plot from a height of 60 to 90 cm above the canopy at nadir position (0° angle) (Sullivan and Holbrook, 2007). Measurements were taken once a week at midday (around 12:00 hr).
Canopy temperature (CT)
Temperature was measured using an infrared thermometer (Extech IR400, Extech Instruments, Nashua, NH). Four readings were taken from the same side of each plot at an angle of approximately 45° from the horizontal plane, ensuring that different regions of the plot were sampled and the laser was striking the plant leaves (Fischer et al., 1998). Measurements were taken twice a week with a spacing of 3 to 4 d between ratings.
Canopy temperature depression (CTD)
This was calculated using the equation:

Ambient temperature at the NESPAL shelter was determined using air temperature sensors (model 083E, Met One Instruments, Grants Pass, OR) placed at the corners of the shelter. Thermal imaging taken through the use of a FLIR Thermal Imager/Camera (FLIR bXX series, FLIR Systems, Wilsonville, OR) was also used to measure CT and compute CTD in 2013. Data were downloaded and analyzed using the FLIR QuickReport software. At the Gibbs Farm shelter, AT was instantly measured after four readings from each plot (Fischer et al., 1998). Measurements were taken twice a week (3 to 4 d spacing between ratings) at solar noon (around 12:00 hr).
Pod yield
At the NESPAL shelter, peanut pods were harvested from each plot at 140 DAP for Tifguard, C76-16, PI 158839, NC3033 and A72 (medium maturing genotypes) and 10 d later for Tifrunner and Florida-07 (medium to late maturing genotypes). At Gibbs Farm shelter, peanut pods were harvested concurrently at 140 DAP. Pods were manually dug and hand-picked at the NESPAL shelter. Harvesting at the Gibbs Farm shelters was done mechanically using a tractor and picker. Pod yield was determined by weighing the harvested pods after cleaning from rocks, soil and other materials then drying to 7% moisture. Yield from the Gibbs Farm shelter was used for quantification of aflatoxin contamination. The NESPAL shelter, however, provided very low yield. Thus, pods were not sufficient for aflatoxin quantification and were saved for a separate study.
Aflatoxin extraction and quantification
Harvested peanut pods from each entire plot at the Gibbs Farm shelter were shelled, ground and mixed thoroughly before representative samples (100 g) were obtained. Aflatoxin content was measured through the standard Vicam fluorometry method. Briefly, the 100 g sample of shelled and ground peanuts were mixed with 10 g NaCl and 200 ml of methanol/water (80:20 v/v), homogenized using a Waring blender (Vicam, Milford, MA) at high speed for 1 min, and filtered through qualitative fluted filter paper (24 cm dia., 25 µm pore size) (Fisher Scientific, Pittsburgh, PA). Five ml filtrate was transferred into 16 mm by 125 mm glass test tube (Fisher Scientific), diluted with 20 ml HPLC water (Fisher Scientific) then re-filtered through glass microfiber filter (11 cm dia., 1.6 µm pore size) (Fisher Scientific). A 10 ml filtrate aliquot was purified with immunoaffinity columns (Vicam) containing aflatoxin-specific (B1, B2, G1 and G2) monoclonal antibodies and washed with 10 ml HPLC water. Column wash with 10 ml HPLC water was repeated then aflatoxin was eluted with 1 ml HPLC grade methanol (Fisher Scientific). The eluted fraction was collected in 12 mm by 75 mm borosilicate glass tubes (Vicam), added with 1 ml fresh Aflatest Developer (Vicam) then swirled in a Vortex mixer (Fisher Scientific) at low speed. Finally, the glass tube was inserted into the fluorometer (series 4EX Fluorometer, Vicam) for aflatoxin quantification. The fluorometer was calibrated using the instructions and aflatoxin calibration standards provided by the manufacturer at the beginning of each day that samples were measured. The HPLC water and reagent blank (1 ml methanol + 1 ml Developer) were also checked on the calibrated fluorometer to make sure that the readings were at 0 ppb.
Data analysis
Individual plots were considered as experimental units where measurements were taken once a week for NDVI and twice a week for visual ratings, chlorophyll fluorescence, SCMR, CT and CTD. Pod yield and aflatoxin contamination were measured from each plot at the end of each season. All the data collected from the NESPAL shelter and the 2013 trial at Gibbs Farm were analyzed using mixed effects ANOVA in SAS 9.2 (SAS Institute, Cary, NC). Water treatment and genotype were considered as fixed effects while replication was considered as a random effect. The data collected from the Gibbs Farm shelter in 2012 were analyzed using one-way PROC ANOVA in SAS where replication was considered as a random effect. Means separation for all analysis was conducted using Fisher LSD test at P ≤ 0.05. Correlation analysis was performed using PROC CORR in SAS to determine relationships among the different phenotyping methods used and with levels of aflatoxin contamination.
Results and Discussion
Visual rating
Data analysis showed significant genotype by treatment (G × T) effects at the NESPAL shelter in 2012 and 2013. Thus, data are presented separately for each genotype and each treatment (Table 1). The stress ratings for WW plants were lower than those exposed to PZS and WPS, except for Tifguard in 2012 and Florida-07 in 2013. No significant difference in ratings was observed among genotypes for the WW treatment in 2012. In both years, Tifguard and Tifrunner had numerically lower ratings than the susceptible check, A72. However, no significant differences from A72 were observed from the WPS afternoon rating for Tifguard as well as the 2012 ratings and WPS afternoon rating in 2013 for Tifrunner. The ratings for C76-16 were lower than A72 under PZS (except afternoon ratings in 2012), but did not differ from A72 under WPS. Florida-07 had lower stress ratings than A72 under WPS (except morning rating in 2012), but not significantly different from A72 under PZS (except morning rating in 2013). The ratings for PI 158839 were not significantly different from A72 under PZS. PI 158839 also exhibited the highest WPS ratings, although it was not significantly different from C76-16 and Florida-07. PI 158839 was replaced with NC 3033 in 2013. The ratings for NC 3033 were lower than A72 under WPS in the morning and under WW treatment in the afternoon. However, plants within a treatment showed dimorphic responses where some plants looked healthy and vigorous while some wilted and dried.
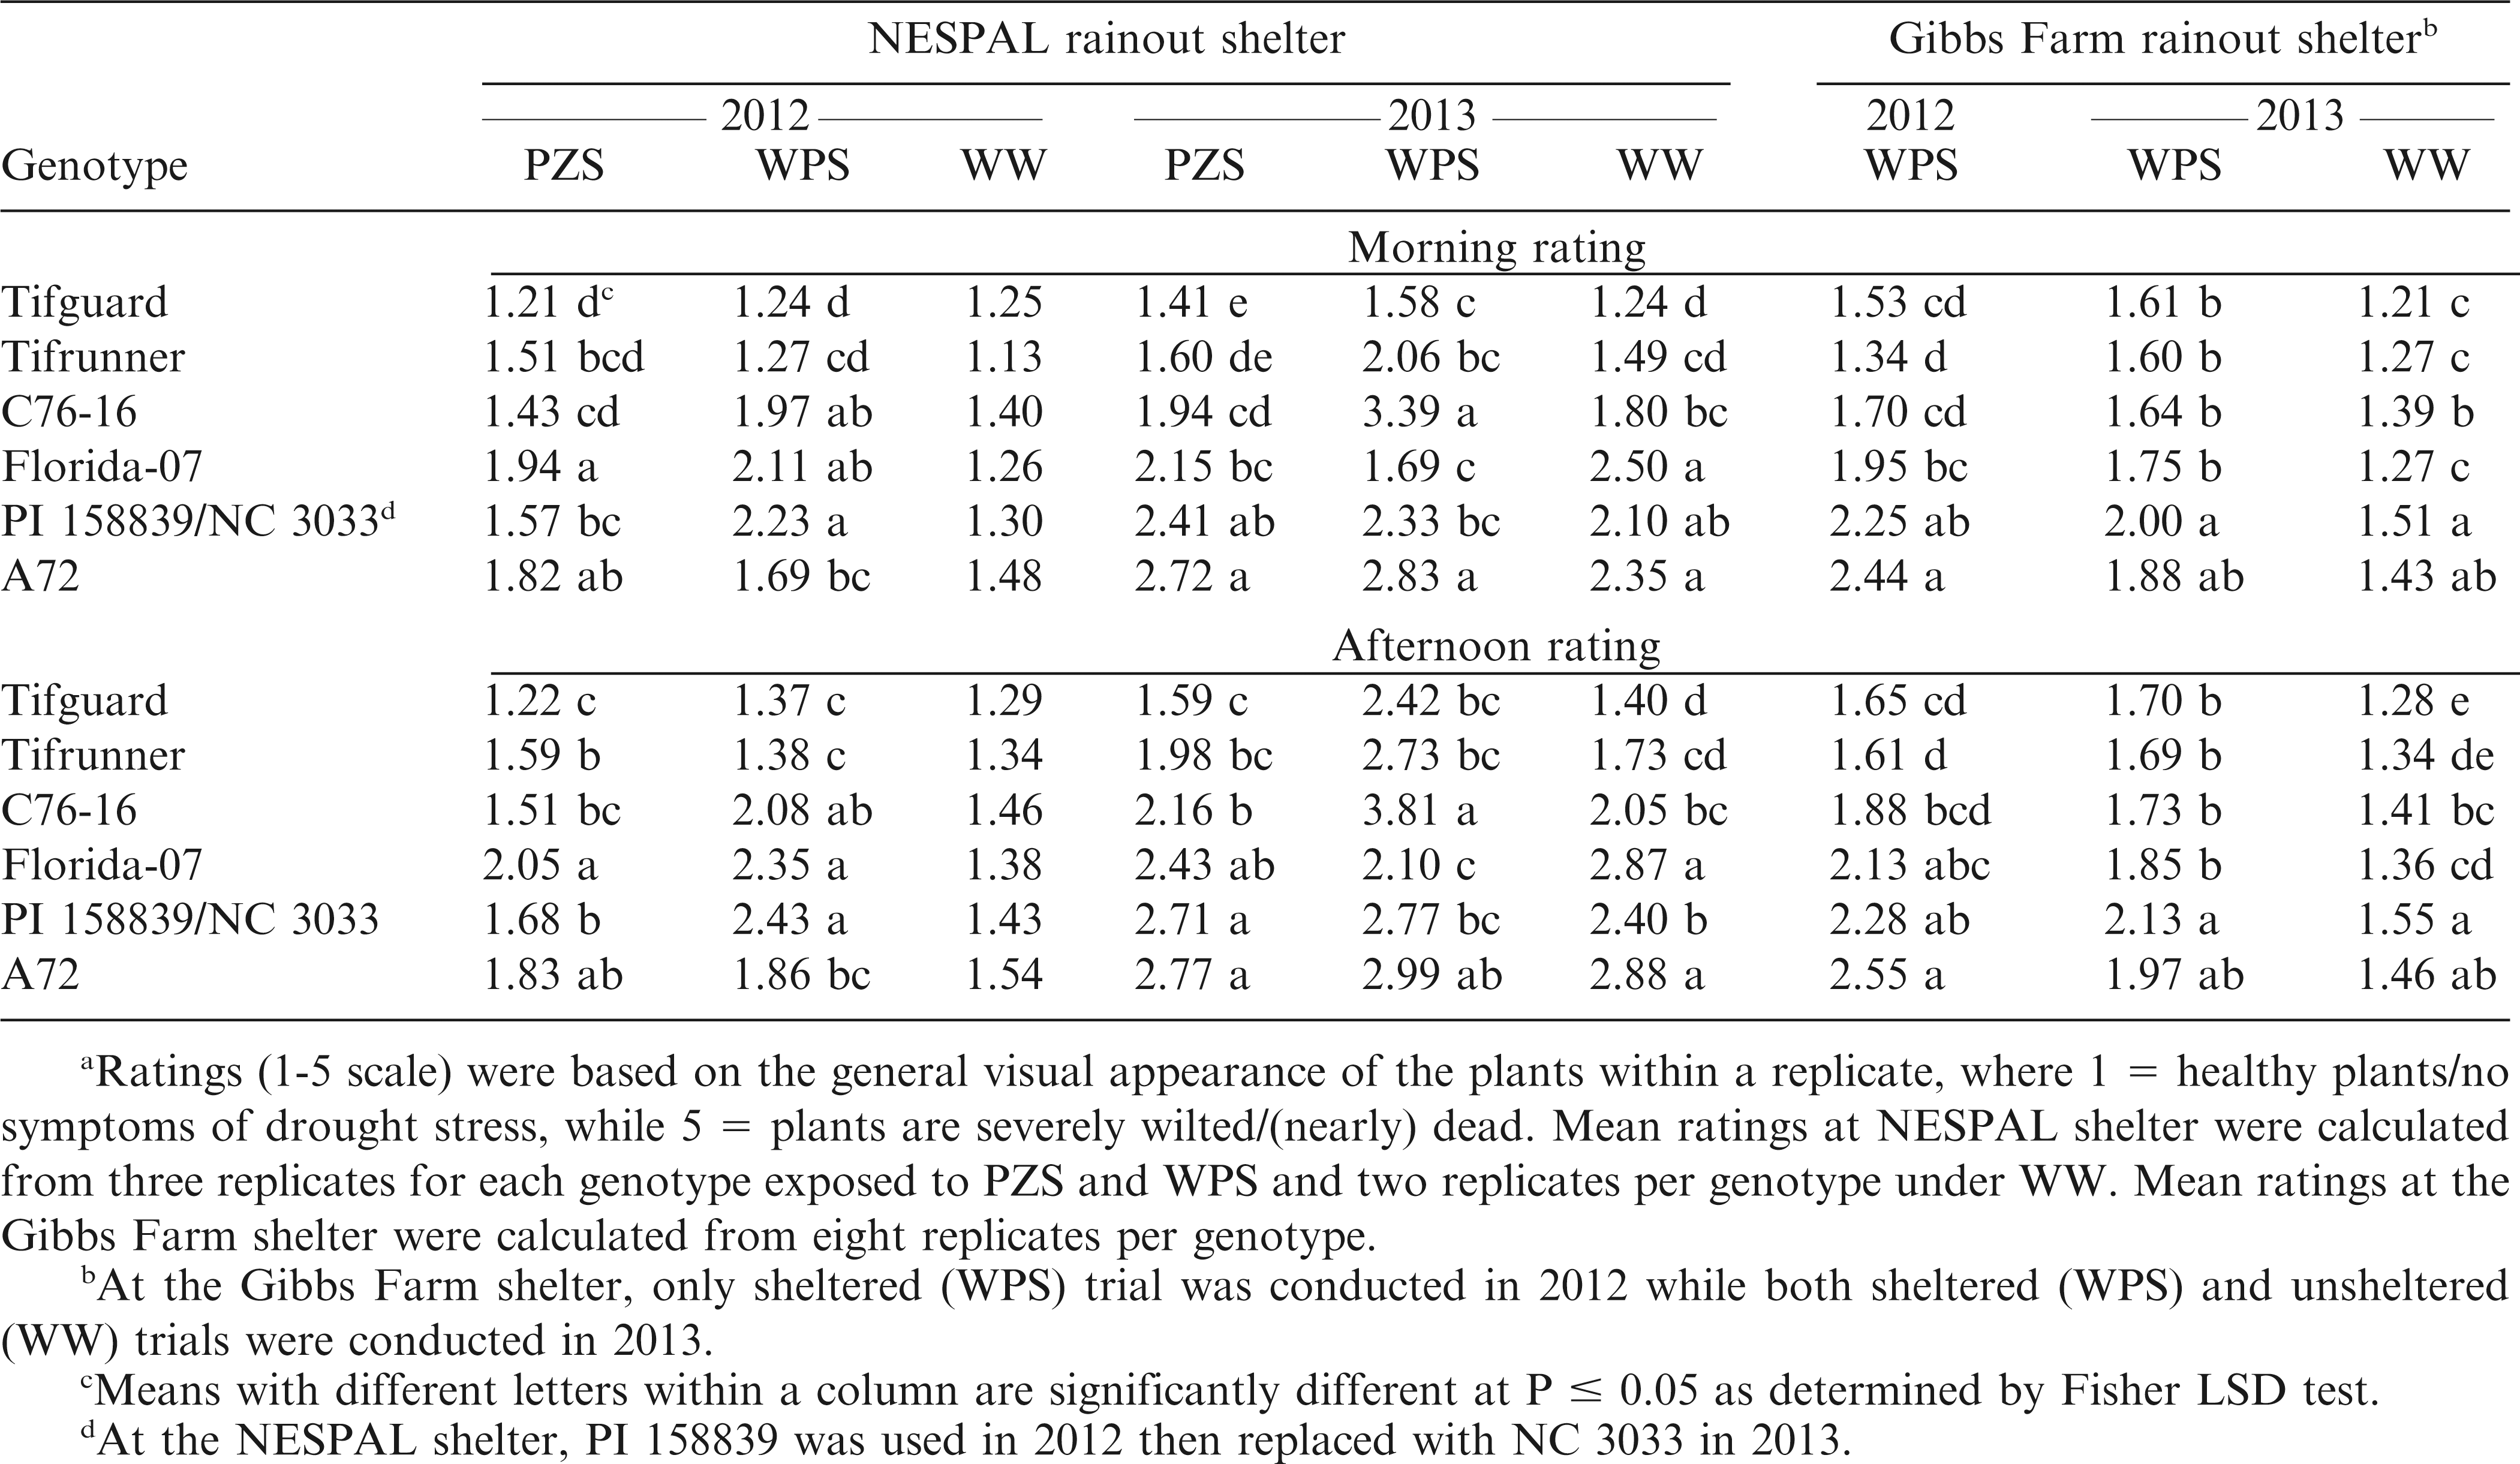
Meana morning (8:00 hr) and afternoon (13:00 hr) visual drought stress ratings of the peanut genotypes exposed to pod zone stress (PZS), whole plant stress (WPS), and well-watered (WW) treatments and to WPS and WW conditions at the NESPAL and the Gibbs Farm rainout shelters, respectively.
Morning ratings at the Gibbs Farm shelter for Tifguard, Tifrunner, C76-16 and Florida-07 were significantly lower than A72 in 2012 (Table 1). On the other hand, only Tifguard, Tifrunner and C76-16 had afternoon ratings that were lower than A72. In 2013, the morning and afternoon ratings for Tifguard, Tifrunner, C76-16 and Florida-07 under WPS were numerically lower but not significantly different from A72.
The stressed plants exhibited permanent foliage wilting, loss of turgor, leaf color change, leaf shedding, and receding of canopy between rows which were similar to the descriptions of Horn and Pitt (1997). Such responses occurred as drought stress adversely affected the photosynthesis (Bhagsari et al., 1976), mineral nutrition, metabolism, and growth of the plants (Suthar and Patel, 1992). In addition, visual ratings in the afternoon were generally higher than in the morning. This may be attributed to the relative water content, osmotic potential, and leaf water potential of the plants. Peanut leaves have high relative water contents in the morning when solar radiation and vapor pressure deficits are low, followed by low water content around midday, and a gradual increase in water content after midday. The same patterns occur for osmotic and water potentials (Erickson and Ketring, 1985). The afternoon ratings (measured around 13:00 hr) had a high probability of being affected by the high solar radiation and vapor pressure deficit of midday.
Chlorophyll fluorescence
Some plant species adapt to conditions of drought, high temperature, and high light (typical of field scenarios) by dissipating excess excitation energy thermally and down regulating photosystem II (PSII) activity in order to protect the photosynthetic apparatus (Bjorkman and Demmig-Adams 1994, Shahen and Isoda, 2010). The state of PSII can be assessed through chlorophyll a fluorescence analysis; the parameters assessed in the present study included PIABS, φEO, and Fv/Fm. The maximum quantum yield of PSII (Fv/Fm) measures the potential photochemical efficiency of PSII (electrons transported per photon of light absorbed). Performance index (PIABS) is a multiparametric expression that takes into account all the main photochemical processes such as absorption and trapping of excitation energy, electron transport, and dissipation of excess excitation energy (Lepedus et al., 2012). Both parameters, together with the quantum yield of electron transport (φEO), can be used to assess damage caused by environmental stresses including high temperature, drought and excess light to PSII and its effect on photosynthesis (Li et al., 2013, Maxwell and Johnson, 2000).
Results from the NESPAL shelter showed significant G × T effect in both years for PIABS, while only in 2013 for φEO and Fv/Fm. The plants exposed to PZS and WPS generally showed reductions in PIABS, φEO and Fv/Fm as compared to WW conditions (Table 2). This reduction in the photosynthetic efficiencies when exposed to drought stress is similar to previous reports for cotton and peanut (Shahen and Isoda, 2010). Data analysis for 2012 indicated that the PIABS of Tifguard, Tifrunner, C76-16 and PI 158839 were significantly different from Florida-07 and A72 when exposed to PZS and WPS. The same trend was obtained for φEO except that no significant G × T effect was observed. Tifrunner had the highest Fv/Fm but was not significantly different from Tifguard. Data analysis for 2013 showed that Tifguard and Tifrunner had the highest PIABS, φEO and Fv/Fm when exposed to PZS. Under WPS, Tifguard had the highest PIABS, φEO and Fv/Fm but was not significantly different from Tifrunner or Florida-07. The ability of Tifguard, Tifrunner, C76-16 and Florida-07 to maintain higher chlorophyll fluorescence values under drought stress suggests that there was less damage to their PSII and that larger proportion of their photosynthetic structure remained more functionally intact (Shahen and Isoda, 2010).
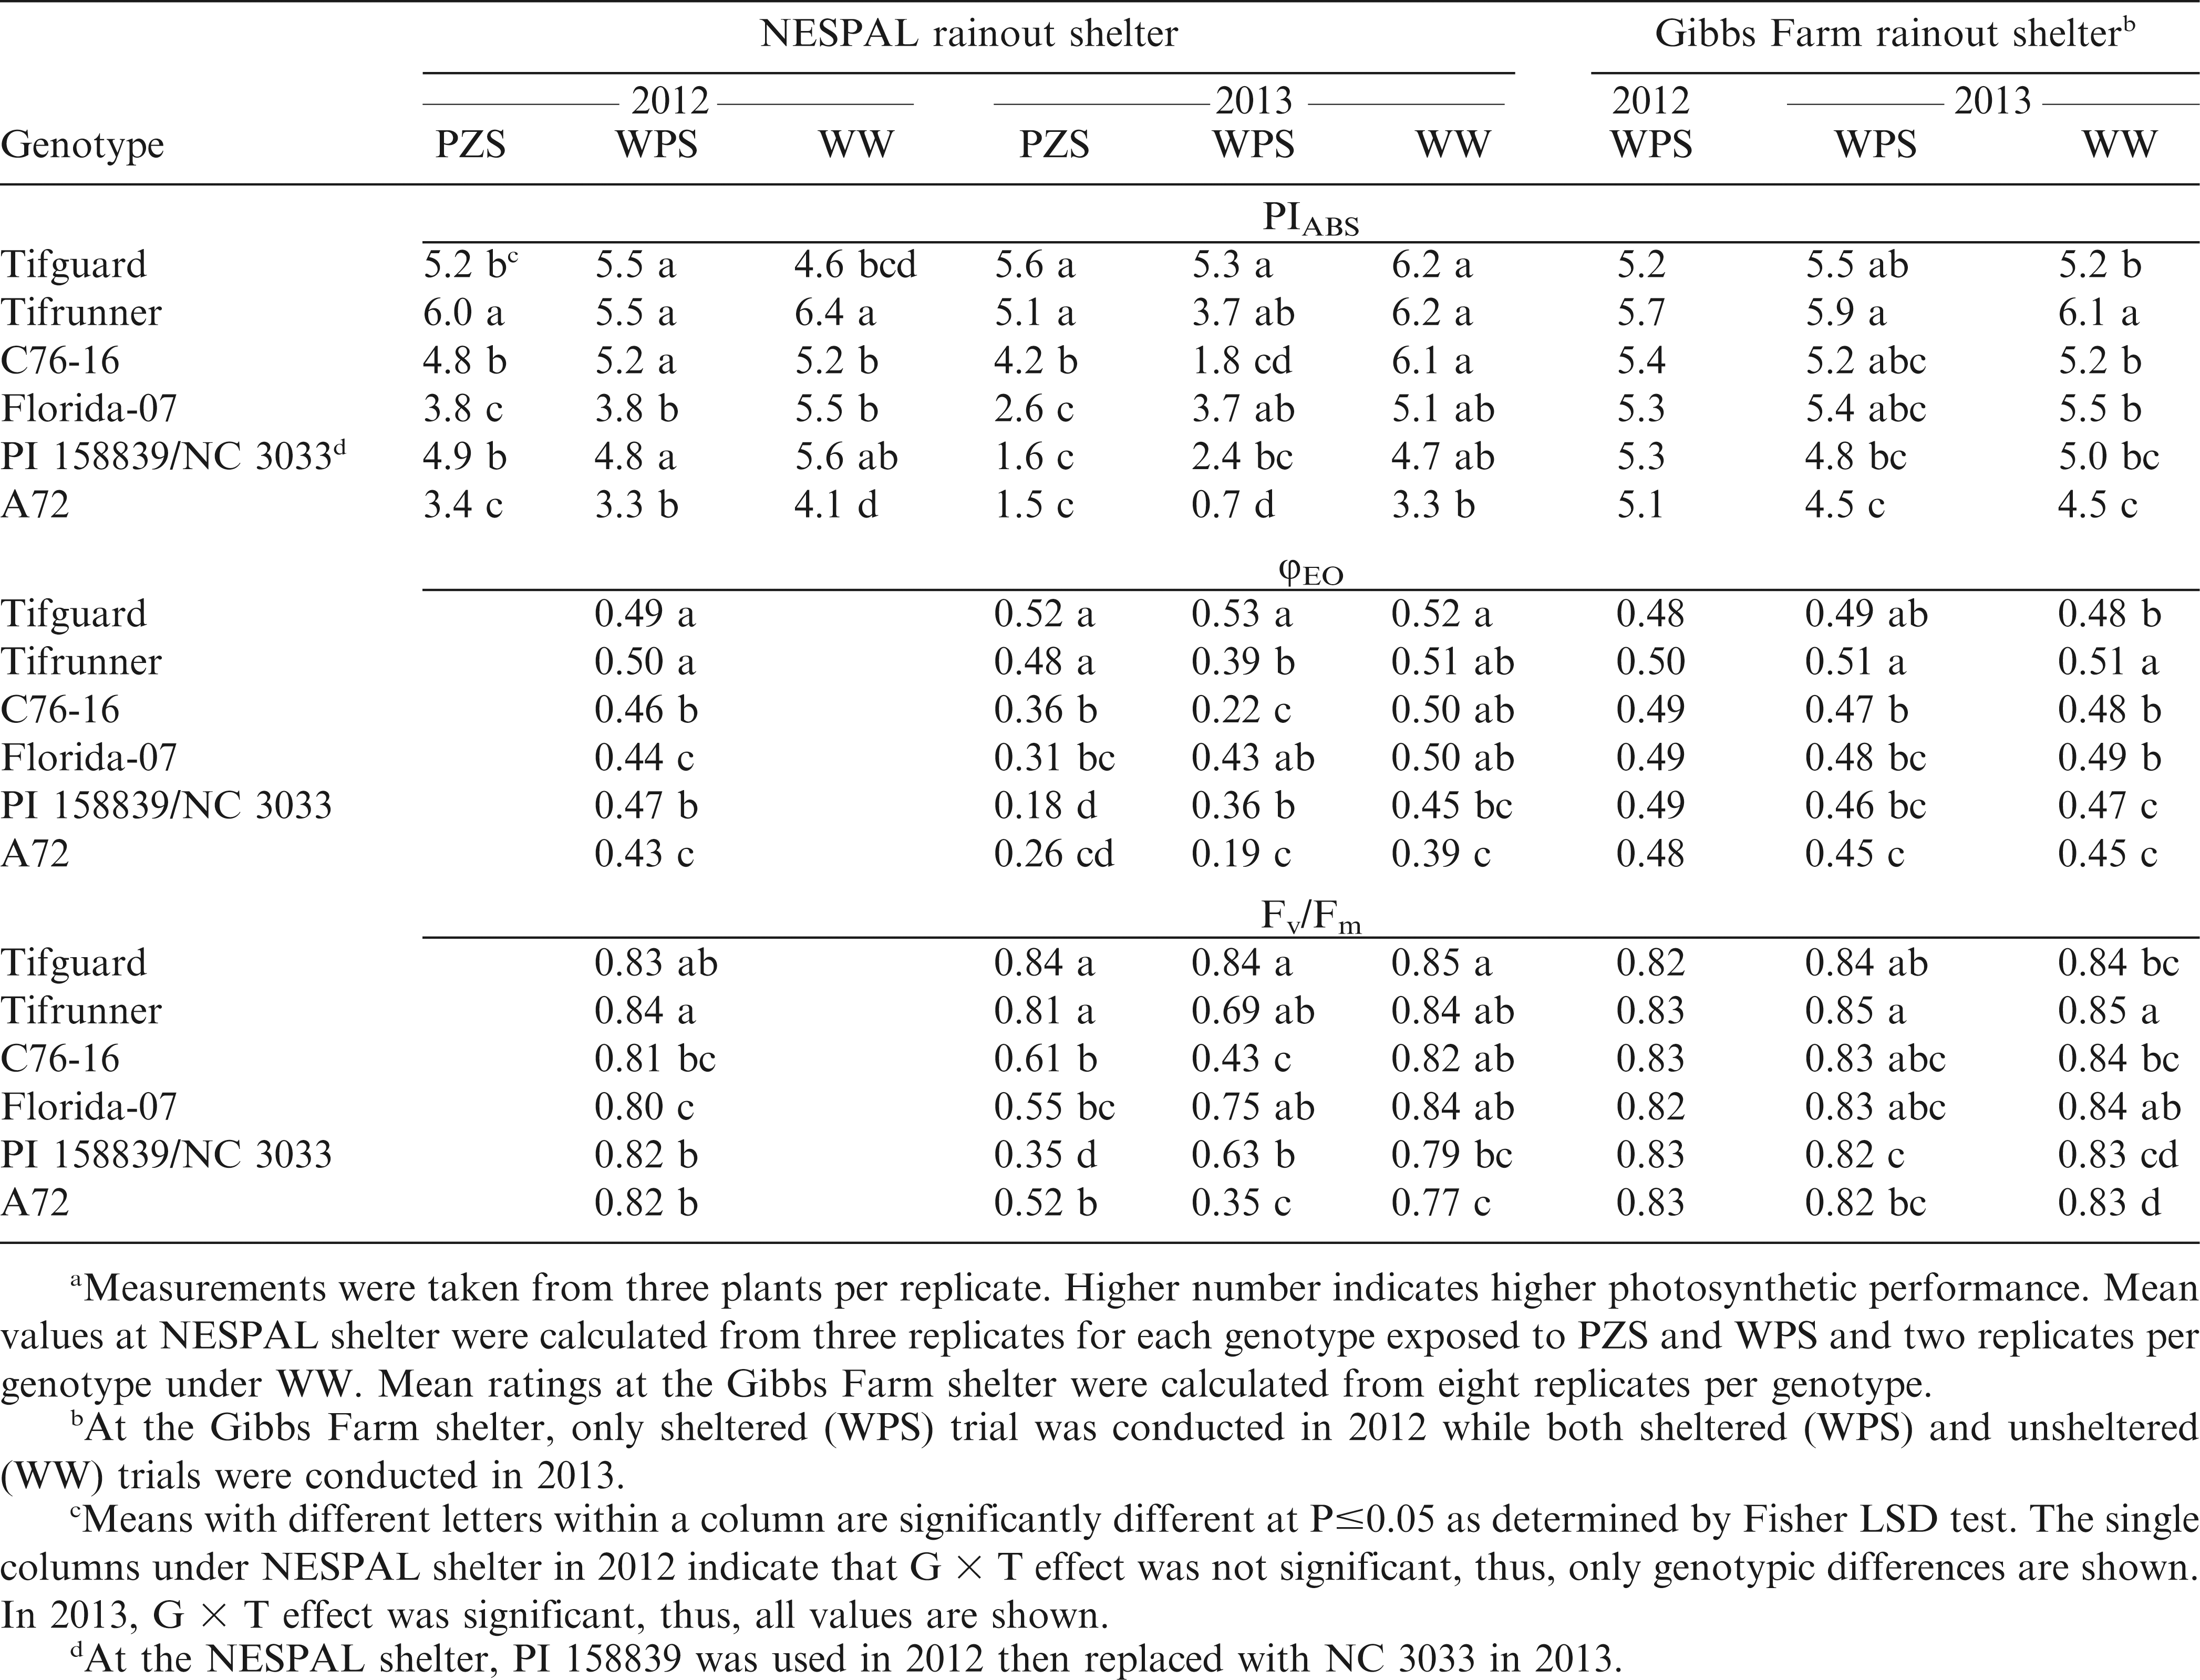
Meana performance index (PIABS), quantum yield of electron transport (φEO) and maximum quantum yield of photosystem II (Fv/Fm) of the peanut genotypes exposed to pod zone stress (PZS), whole plant stress (WPS), and well-watered (WW) treatments and to WPS and WW conditions at the NESPAL and the Gibbs Farm rainout shelters, respectively.
The observed few differences in the results of PIABS, Fv/Fm, and φEO regarding genotypic responses to drought stress at the NESPAL shelter was also reported by Lepedus et al. (2012) between Fv/Fm and PIABS in their study with maize. This led to their recommendation that these parameters be combined when evaluating genotypes for drought tolerance. In the current study, the data from Gibbs Farm showed very similar results for PIABS, Fv/Fm, and φEO (Table 2). There was no significant difference in the PIABS, φEO, and Fv/Fm among genotypes in 2012. In 2013, Tifrunner had the highest PIABS, φEO, and Fv/Fm but was not significantly different from the φEO of Tifguard as well as the PIABS and Fv/Fm of Tifguard, C76-16 and Florida-07 under drought-stressed condition. The correlation analysis (Table 3) also showed that only Fv/Fm was significantly correlated with aflatoxin contamination. This suggests that Fv/Fm may be sufficient to evaluate chlorophyll fluorescence in peanut.
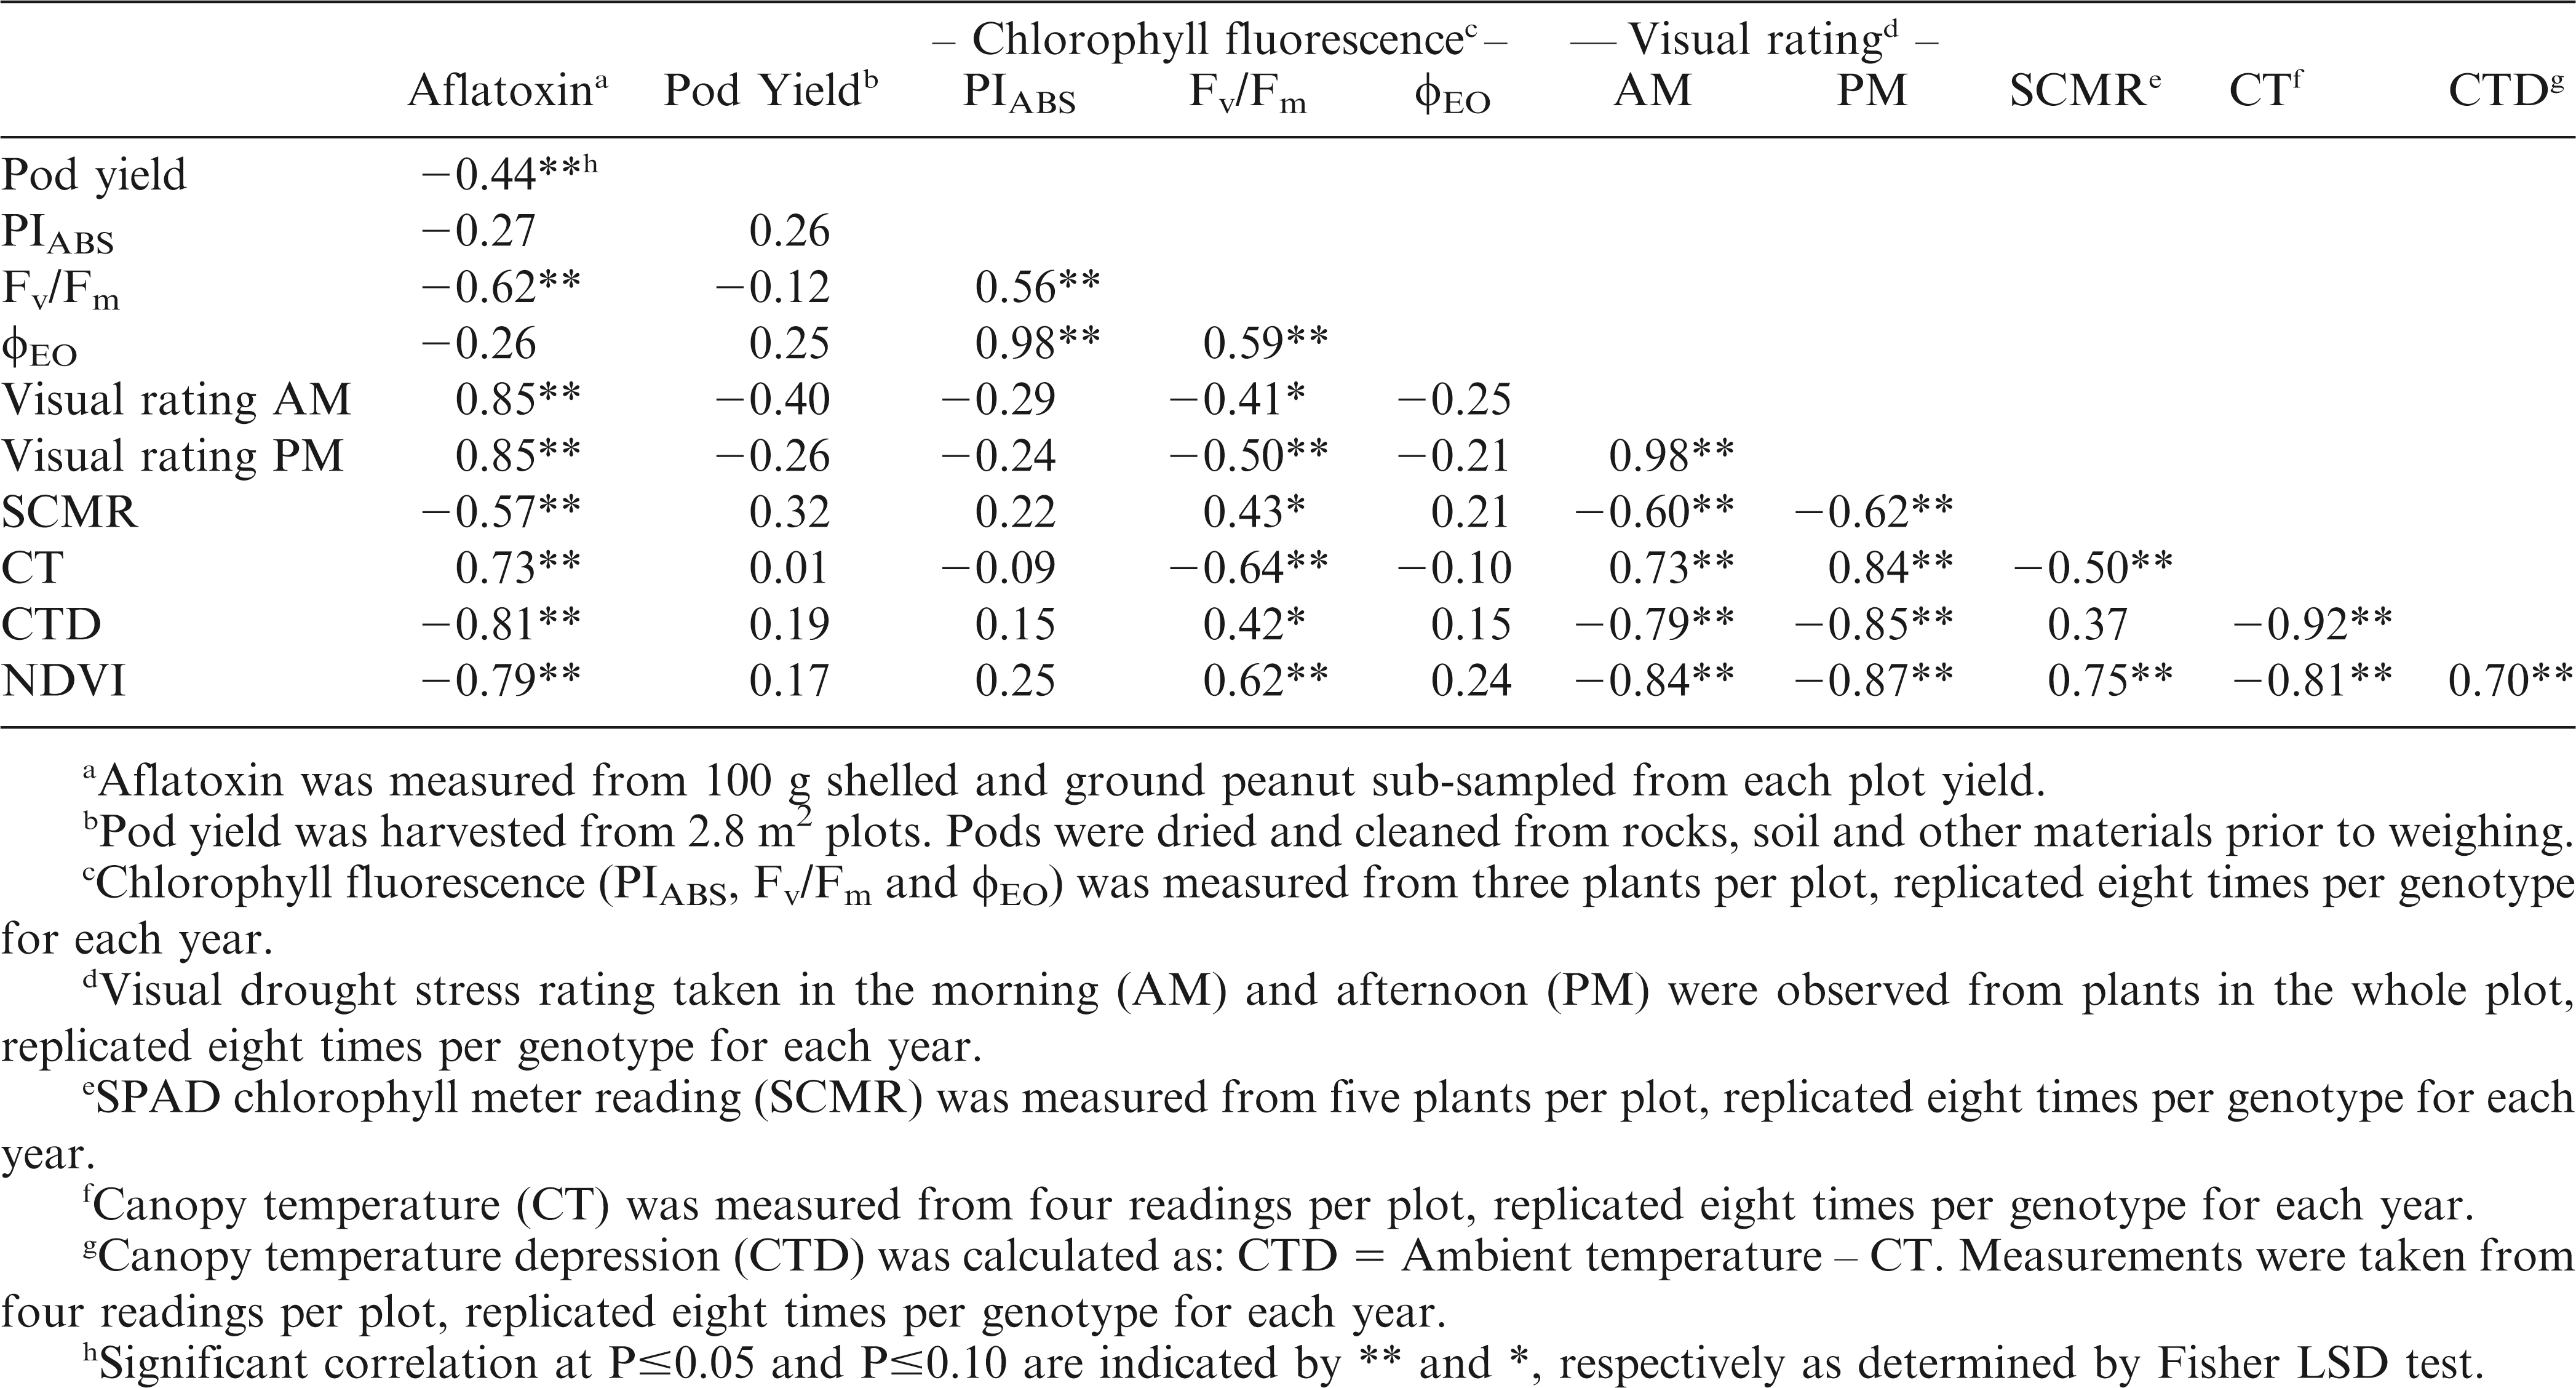
Correlation between aflatoxin contamination, yield and drought stress evaluation methods of the peanut genotypes planted at the Gibbs Farm shelter.
SCMR
Maintenance of chlorophyll content under water-limited conditions has been suggested as a mechanism for drought tolerance in peanut. SCMR measures the chlorophyll content per unit area of a leaf through the light absorbance and/or transmittance characteristic of a leaf. SCMR is positively correlated with chlorophyll content and chlorophyll density, thus it can be used to screen for genotypic variation in photosynthetic capacity (Arunyanark et al., 2008, Sheshshayee et al., 2006).
No significant G × T effect was observed from the NESPAL shelter in 2012, but G × T interaction was significant in 2013. A general decrease in SCMR was observed when plants were exposed to PZS and WPS as compared to WW conditions, except for Tifguard which maintained similar SCMR under WPS and WW treatments (Table 4). Tifguard exhibited the highest SCMR in both years, but was not significantly different from Tifrunner under PZS in 2013. Tifguard also exhibited the highest SCMR at Gibbs Farm in both years. This suggests that Tifguard contains higher chlorophyll content and has greater photosynthetic capacity than the other genotypes. Visual observation also showed that Tifguard has deep green leaf color which was retained by the plants despite exposure to drought stress.
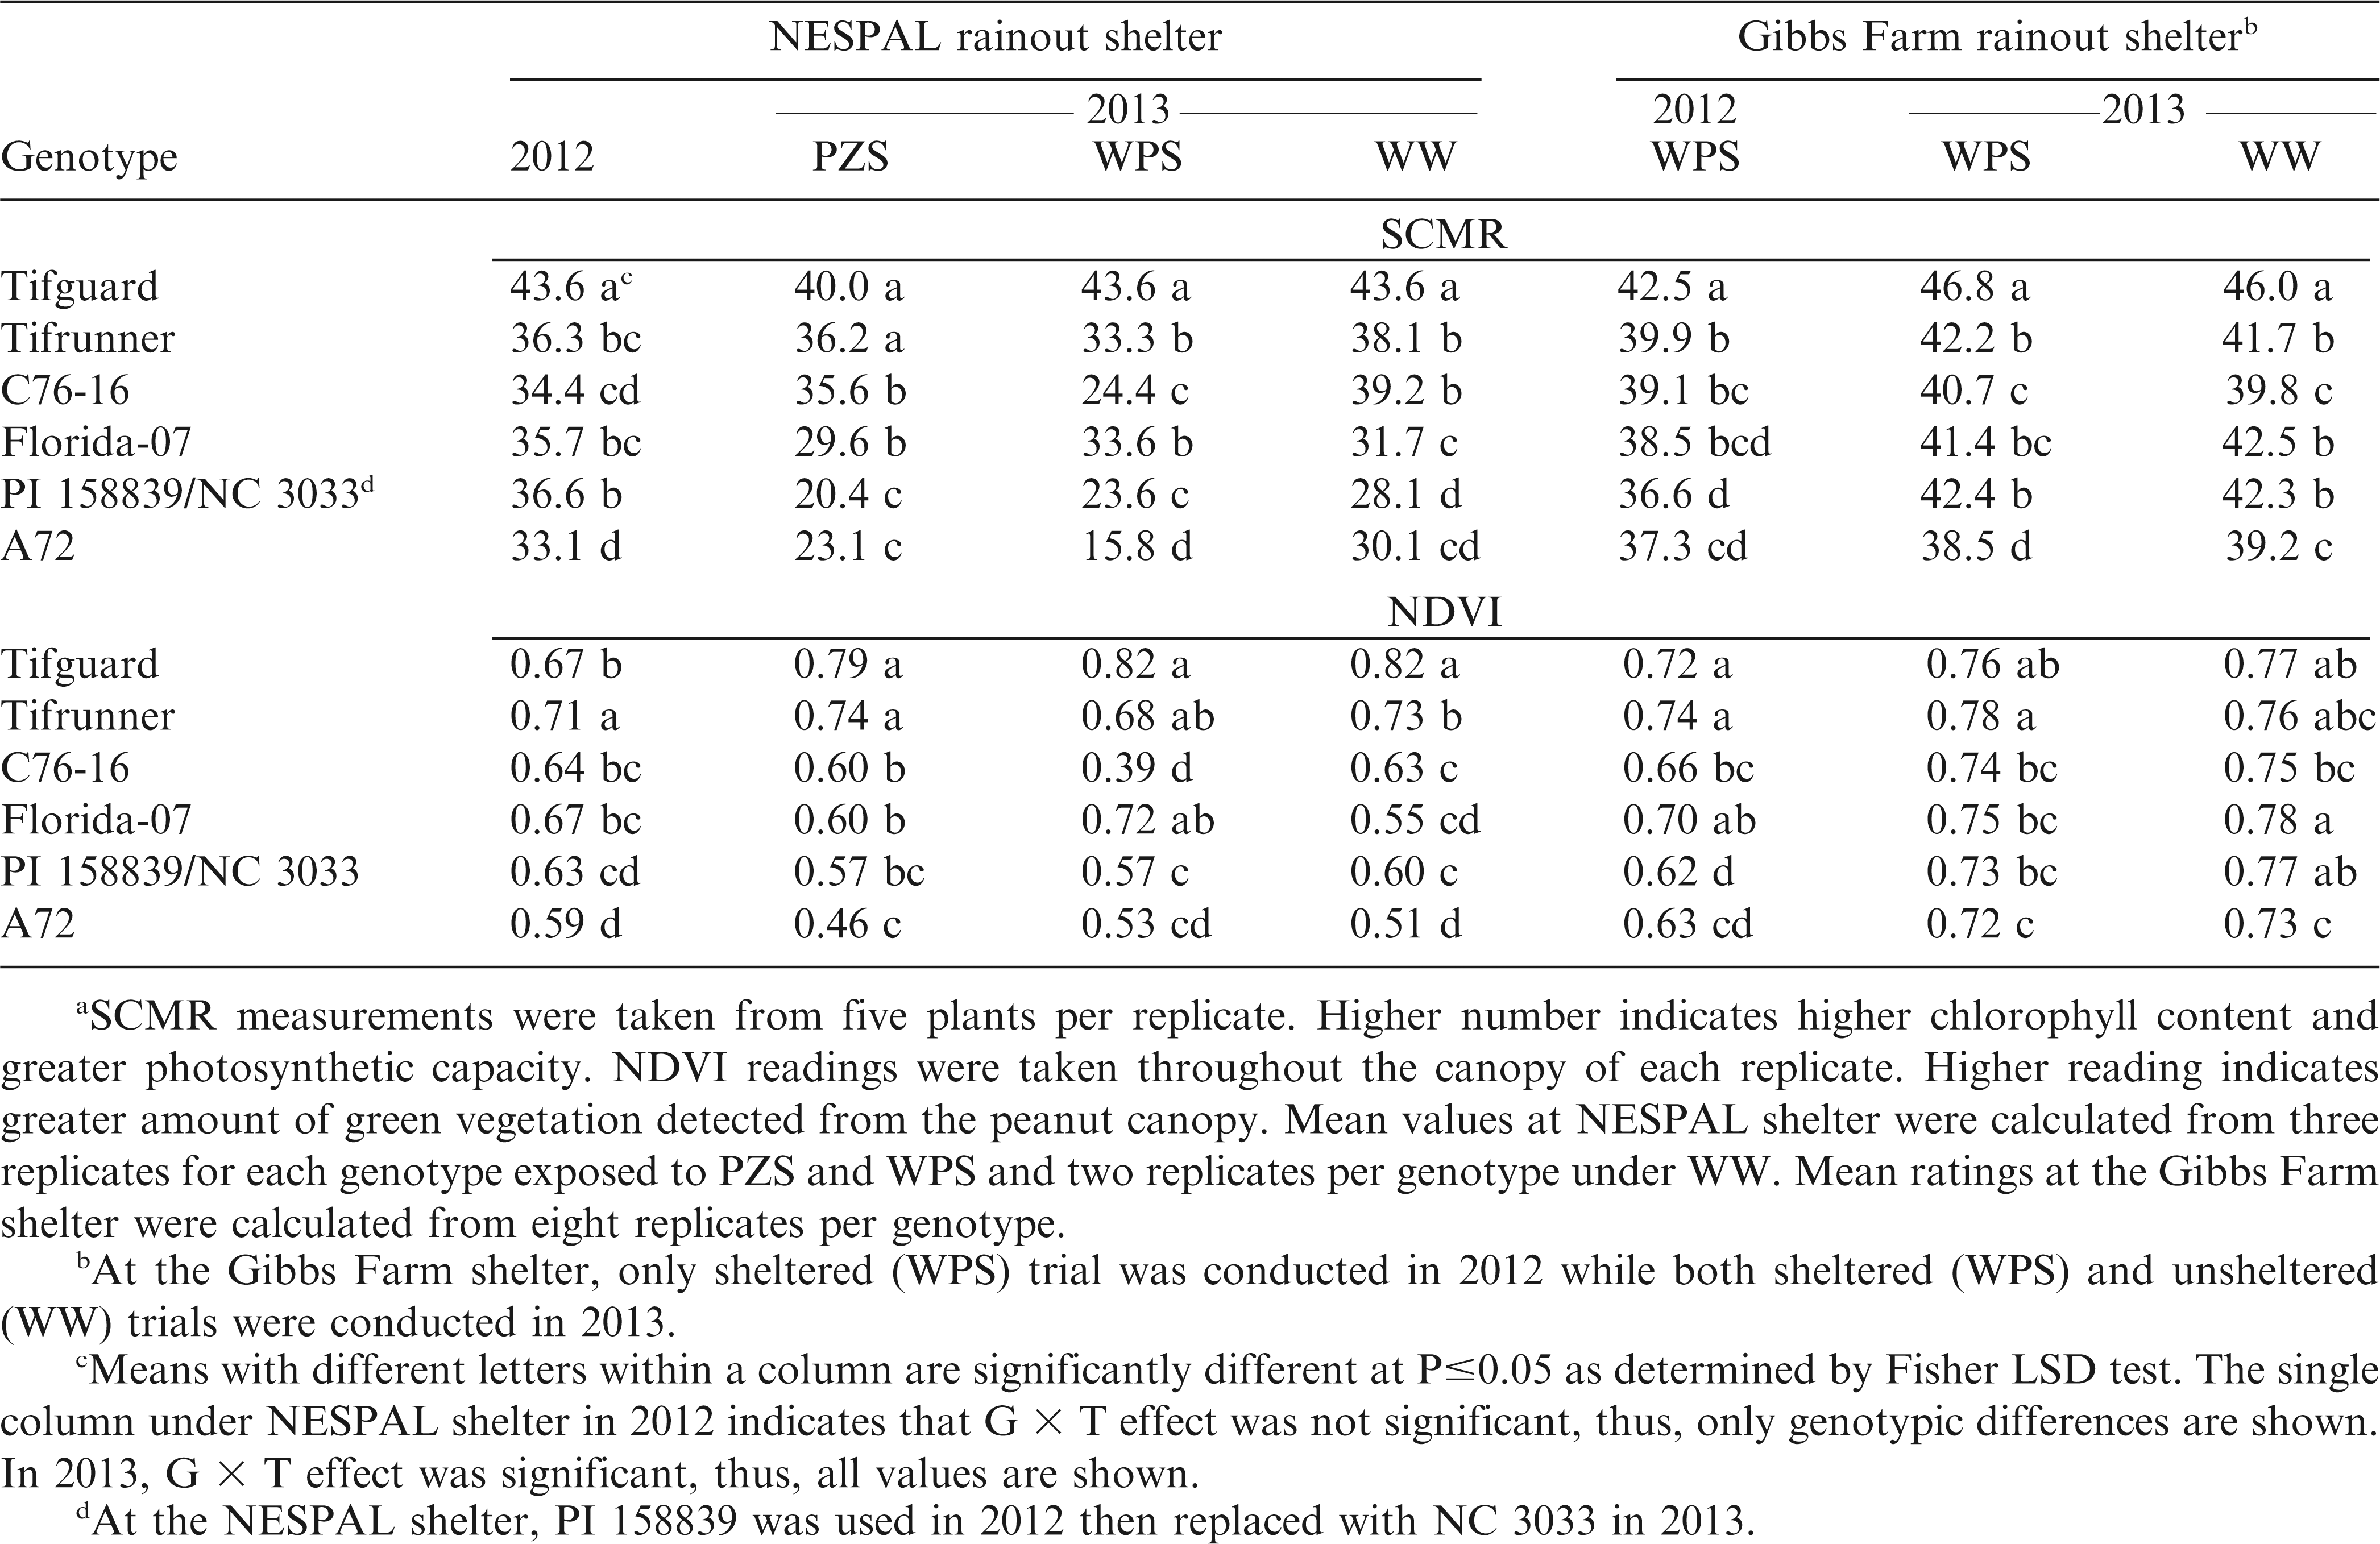
Meana soil plant analysis development (SPAD) chlorophyll meter reading (SCMR) and normalized difference vegetation index (NDVI) of the peanut genotypes exposed to pod zone stress (PZS), whole plant stress (WPS), and well-watered (WW) treatments and to WPS and WW conditions at the NESPAL and the Gibbs Farm rainout shelters, respectively.
NDVI
This tool uses the visible and near-infrared bands of the electromagnetic spectrum to analyze remote sensing measurements and assess live green vegetation. Healthy vegetation, which correlates to higher photosynthetic capacity and indicated by a higher NDVI, is detected as it absorbs most of the visible light that hits it and reflects a large portion of the near-infrared light. On the other hand, unhealthy or sparse vegetation reflects more visible light and less near-infrared light (Holm et al., 1987, Weier and Herring, 2000).
No significant G × T effect was observed at the NESPAL shelter in 2012 where Tifrunner exhibited the highest NDVI (Table 4). In contrast, significant G × T effect was observed in 2013. Well-watered plants exhibited higher NDVI than plants exposed to PZS and WPS. Tifguard and Tifrunner had the highest NDVI under PZS. Tifguard had the highest NDVI under WPS but was not significantly different from Tifrunner and Florida-07. Observations from the Gibbs Farm shelter in 2012 showed that Tifguard and Tifrunner had the highest NDVI, but were not significantly different from Florida-07. In 2013, Tifrunner had the highest NDVI, but was not significantly different from Tifguard under drought-stressed condition. The high NDVI of Tifguard, Tifrunner and Florida-07 indicate detection of higher amount of green vegetation and potential for greater photosynthetic capacity. The lower NDVI of the other genotypes was probably affected by wilting and receding of the plant canopy due to drought.
CT
Canopy temperature examines drought tolerance based on the negative correlation between leaf temperature and transpirational cooling (Jackson, 1982). Genotypes that are drought-tolerant tend to maintain cooler canopies under stressed conditions (Ayeneh et al., 2002).
Evaluation of CT using an infrared thermometer at the NESPAL shelter in 2012 showed significant G × T effect, but no significant differences among genotypes under PZS and WW treatments (Table 5). Under WPS, Tifrunner had the lowest CT but was not significantly different from C76-16 and A72. In 2013, the G × T effect was not significant. Evaluation using infrared thermometer showed Tifguard and Tifrunner had the lowest CT. Evaluation using thermal imaging in the same year showed that Tifguard had the lowest CT but was not significantly different from Tifrunner and C76-16. Both methods identified Tifguard, Tifrunner and C76-16 to be significantly different from A72 suggesting that these genotypes with lower CT have higher transpiration and carbon dioxide exchange rates than genotypes with high CT (Jongrungklang et al., 2008).
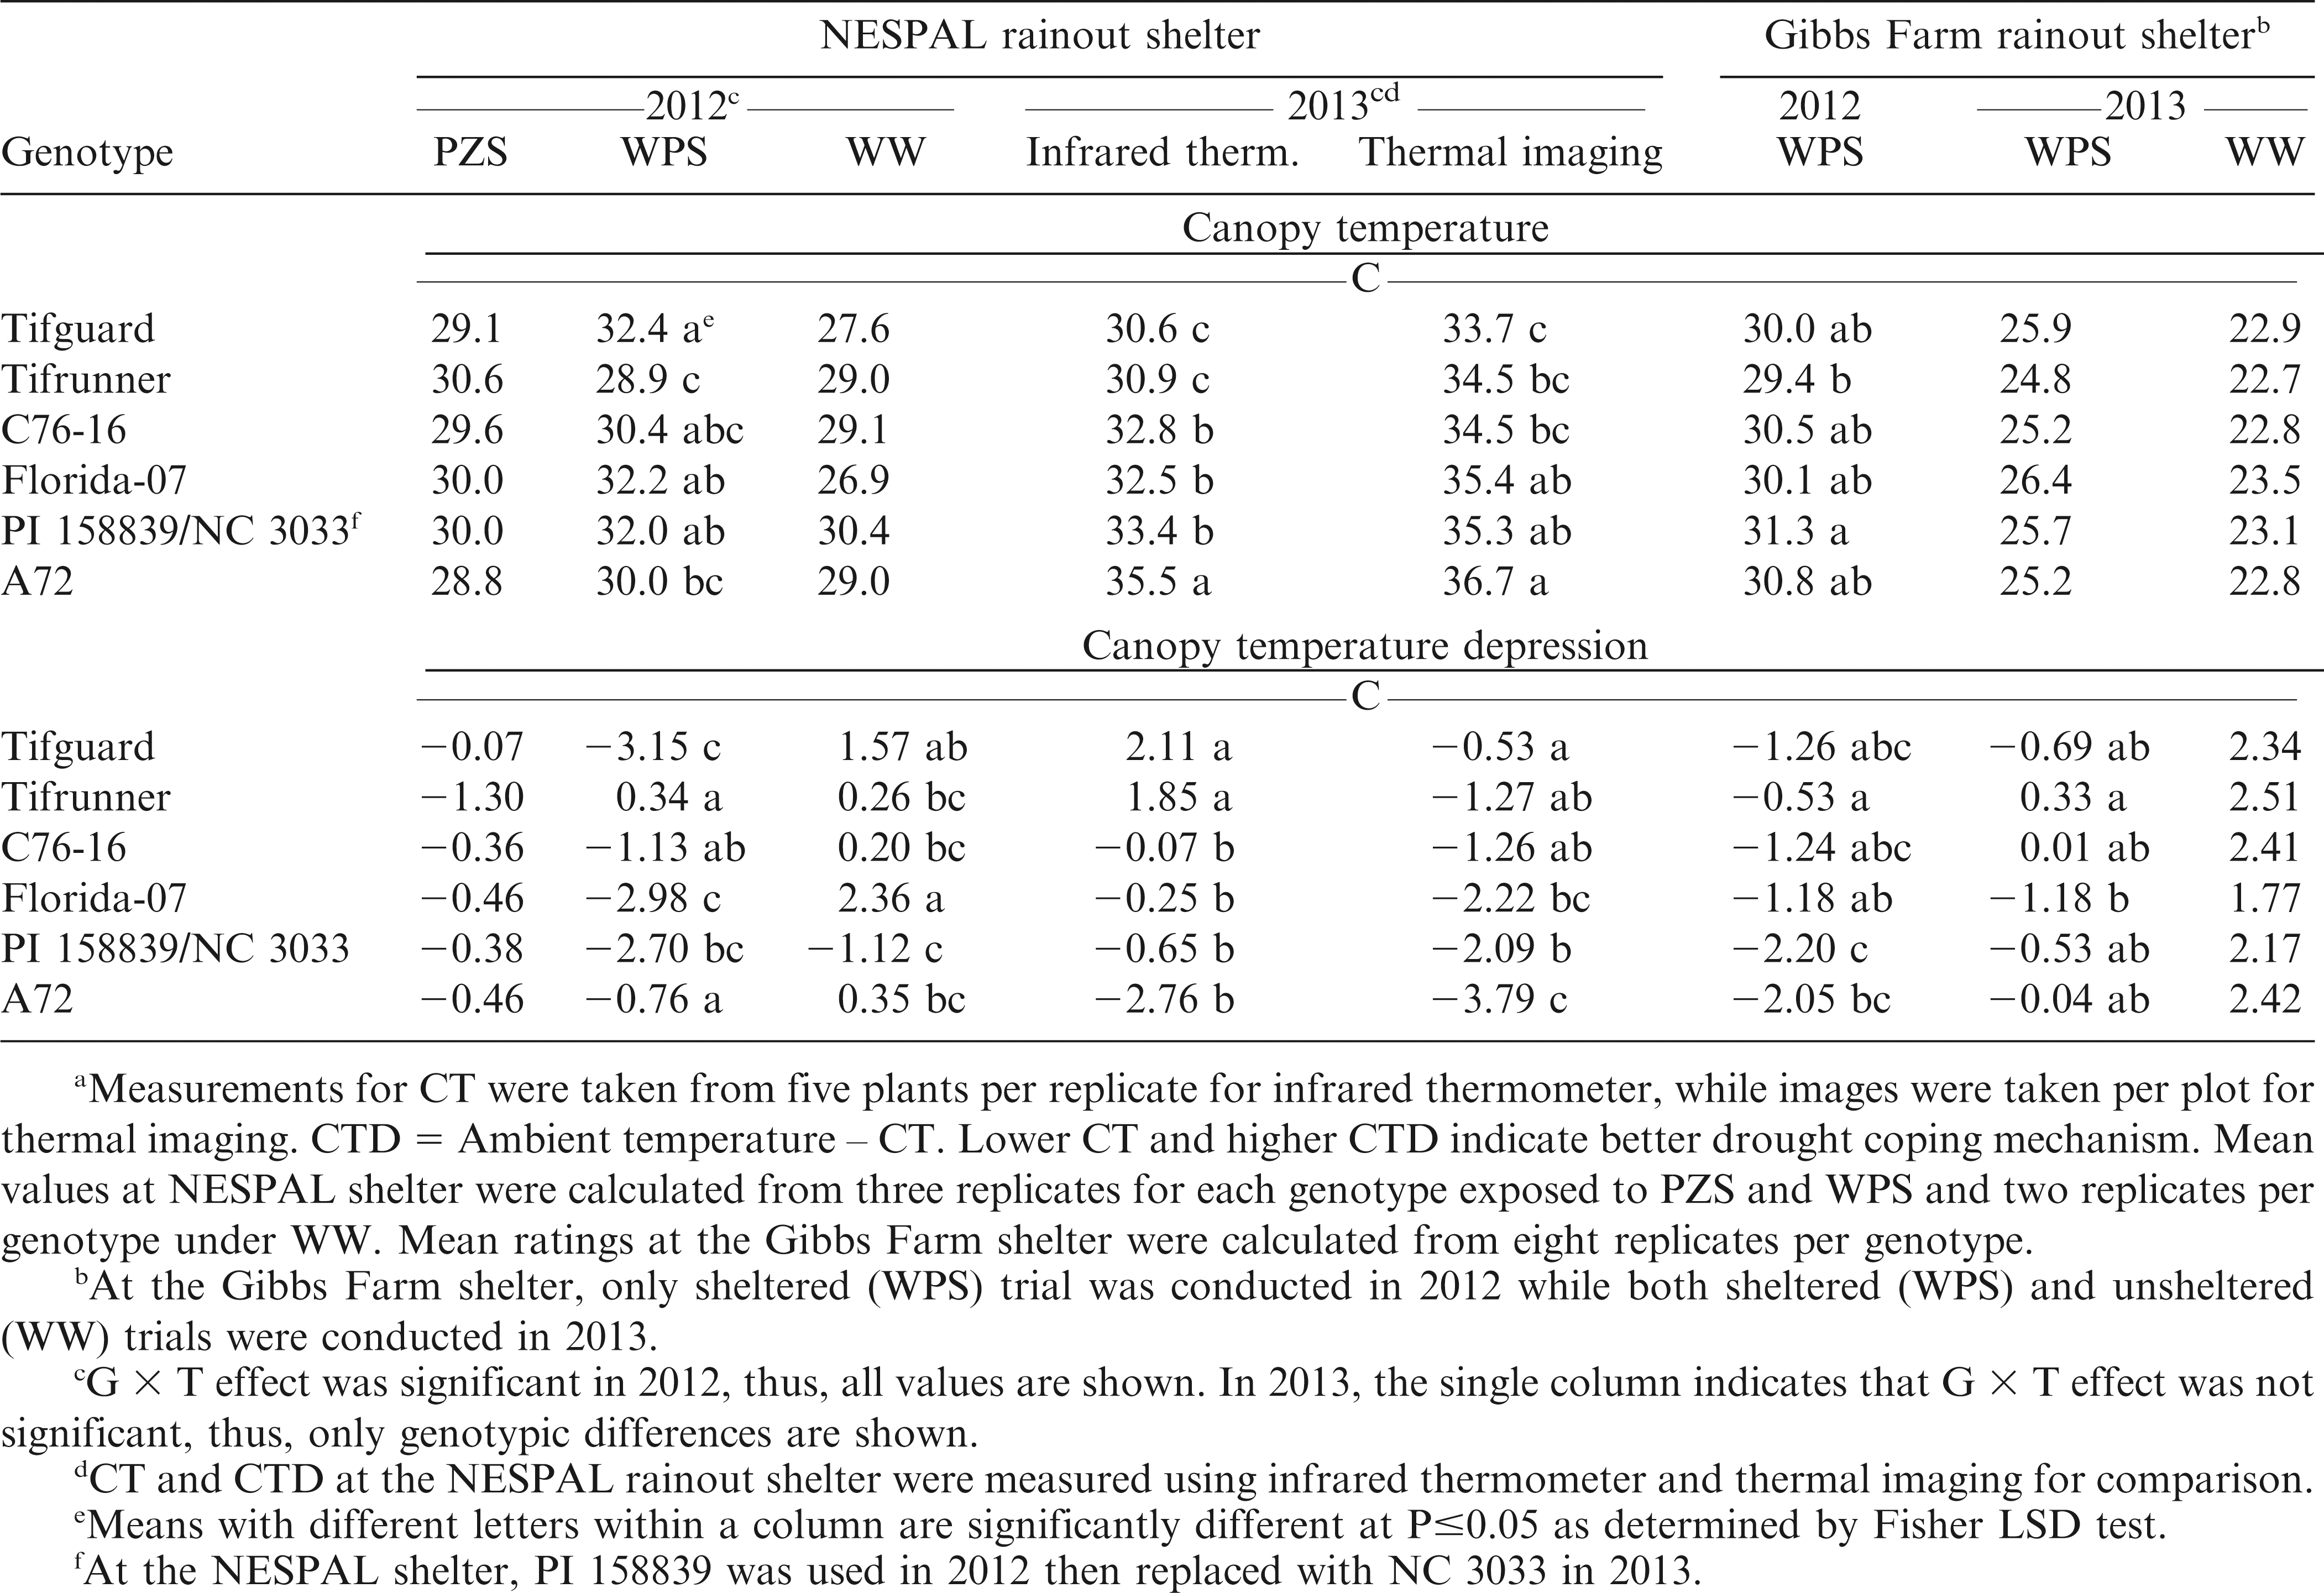
Meana canopy temperature (CT) and canopy temperature depression (CTD) of the peanut genotypes under pod zone stress (PZS), whole plant stress (WPS), and well-watered (WW) treatments and WPS and WW conditions at the NESPAL and the Gibbs Farm rainout shelters, respectively.
At the Gibbs Farm shelter, the lowest CT in 2012 was also observed from Tifrunner but was not significantly different from most of the other genotypes including A72 (Table 5). In 2013, no significant differences among genotypes were observed under WPS and WW conditions.
CTD
In relation to CT, CTD measures the deviation of plant temperature from AT. It is used to indicate overall plant water status resulting from the effects of several biochemical and morphophysiological features acting at the stomata, leaf, and canopy levels (Amani et al., 1996, Tuberosa, 2011). High CTD is selected for drought tolerance and heat avoidance (Karimizadeh and Mohammadi, 2011). Based on the working principle of CTD, plants exposed to water stress exhibit reduced transpiration due to stomatal closure to avoid water stress. However, tolerant genotypes are able to maintain higher transpiration rates and cooler canopies as compared to sensitive genotypes (Jackson, 1982, Turner et al., 1986).
Evaluation of CTD at the NESPAL shelter in 2012 showed significant G × T effect but no significant differences among genotypes under PZS (Table 5).Under WPS, only Tifrunner had a positive CTD. The negative CTD of the other genotypes was acquired because the temperature of the canopy was higher than AT. Thus, indicating that the plants were undergoing some level of drought stress. Tifrunner, which had a cooler canopy in this situation, was more likely to be under less stress and was able to maintain higher transpiration than the other genotypes. In 2013, evaluation using an infrared thermometer showed that the CTD of Tifguard and Tifrunner were significantly higher than the rest of the genotypes. When evaluated using thermal imaging, Tifguard had the highest CTD but was not significantly different from Tifrunner and C76-16. The slight difference in results produced by the two devices might be attributed to the difference in atmospheric factors like solar radiation during the time that the measurements were taken. By necessity, both methods cannot be measured at exactly the same time. At the Gibbs Farm shelter, the CTD of Tifrunner was significantly higher than A72 in 2012 but was not significantly different from Tifguard, C76-16 and Florida-07. In 2013, highest CTD was observed from Tifrunner but was not significantly different from most of the other genotypes including A72. No significant differences among genotypes were observed under the WW condition.
Pod yield
The harvested average pod yields ranged from 2049 to 4202 kg/ha (Table 6). In 2012, the highest yield was obtained from C76-16 but this was not significantly different from Tifrunner and Florida-07. In 2013, Tifguard gave the highest yield but was not significantly different from Tifrunner, C76-16, Florida-07 and PI 158839 under the drought stressed condition. According to the study of Koolachart et al. (2013), drought-tolerant peanut genotypes can either have high yield potential under irrigated conditions or low reduction in yield under drought. Peanut genotypes with high yield potential experienced reduced number of pods per plant, number of seeds per pod and seed size but the yield performance of these peanut genotypes were still higher than average. For some of the peanut genotypes with low potential, the yield performance under drought was comparable to those with high potential. In the current study, Tifguard, C76-16 and Florida-07 had shown high yield potential under WW while showing acceptable yield performance under WPS. PI 158839, which was not significantly different from C76-16, exhibited the highest DTI but had low yield potential under WPS and WW. It was also observed that PI 158839 had higher yield performance under WPS than WW. This genotype should be studied further in future studies to find the reasons behind this performance.
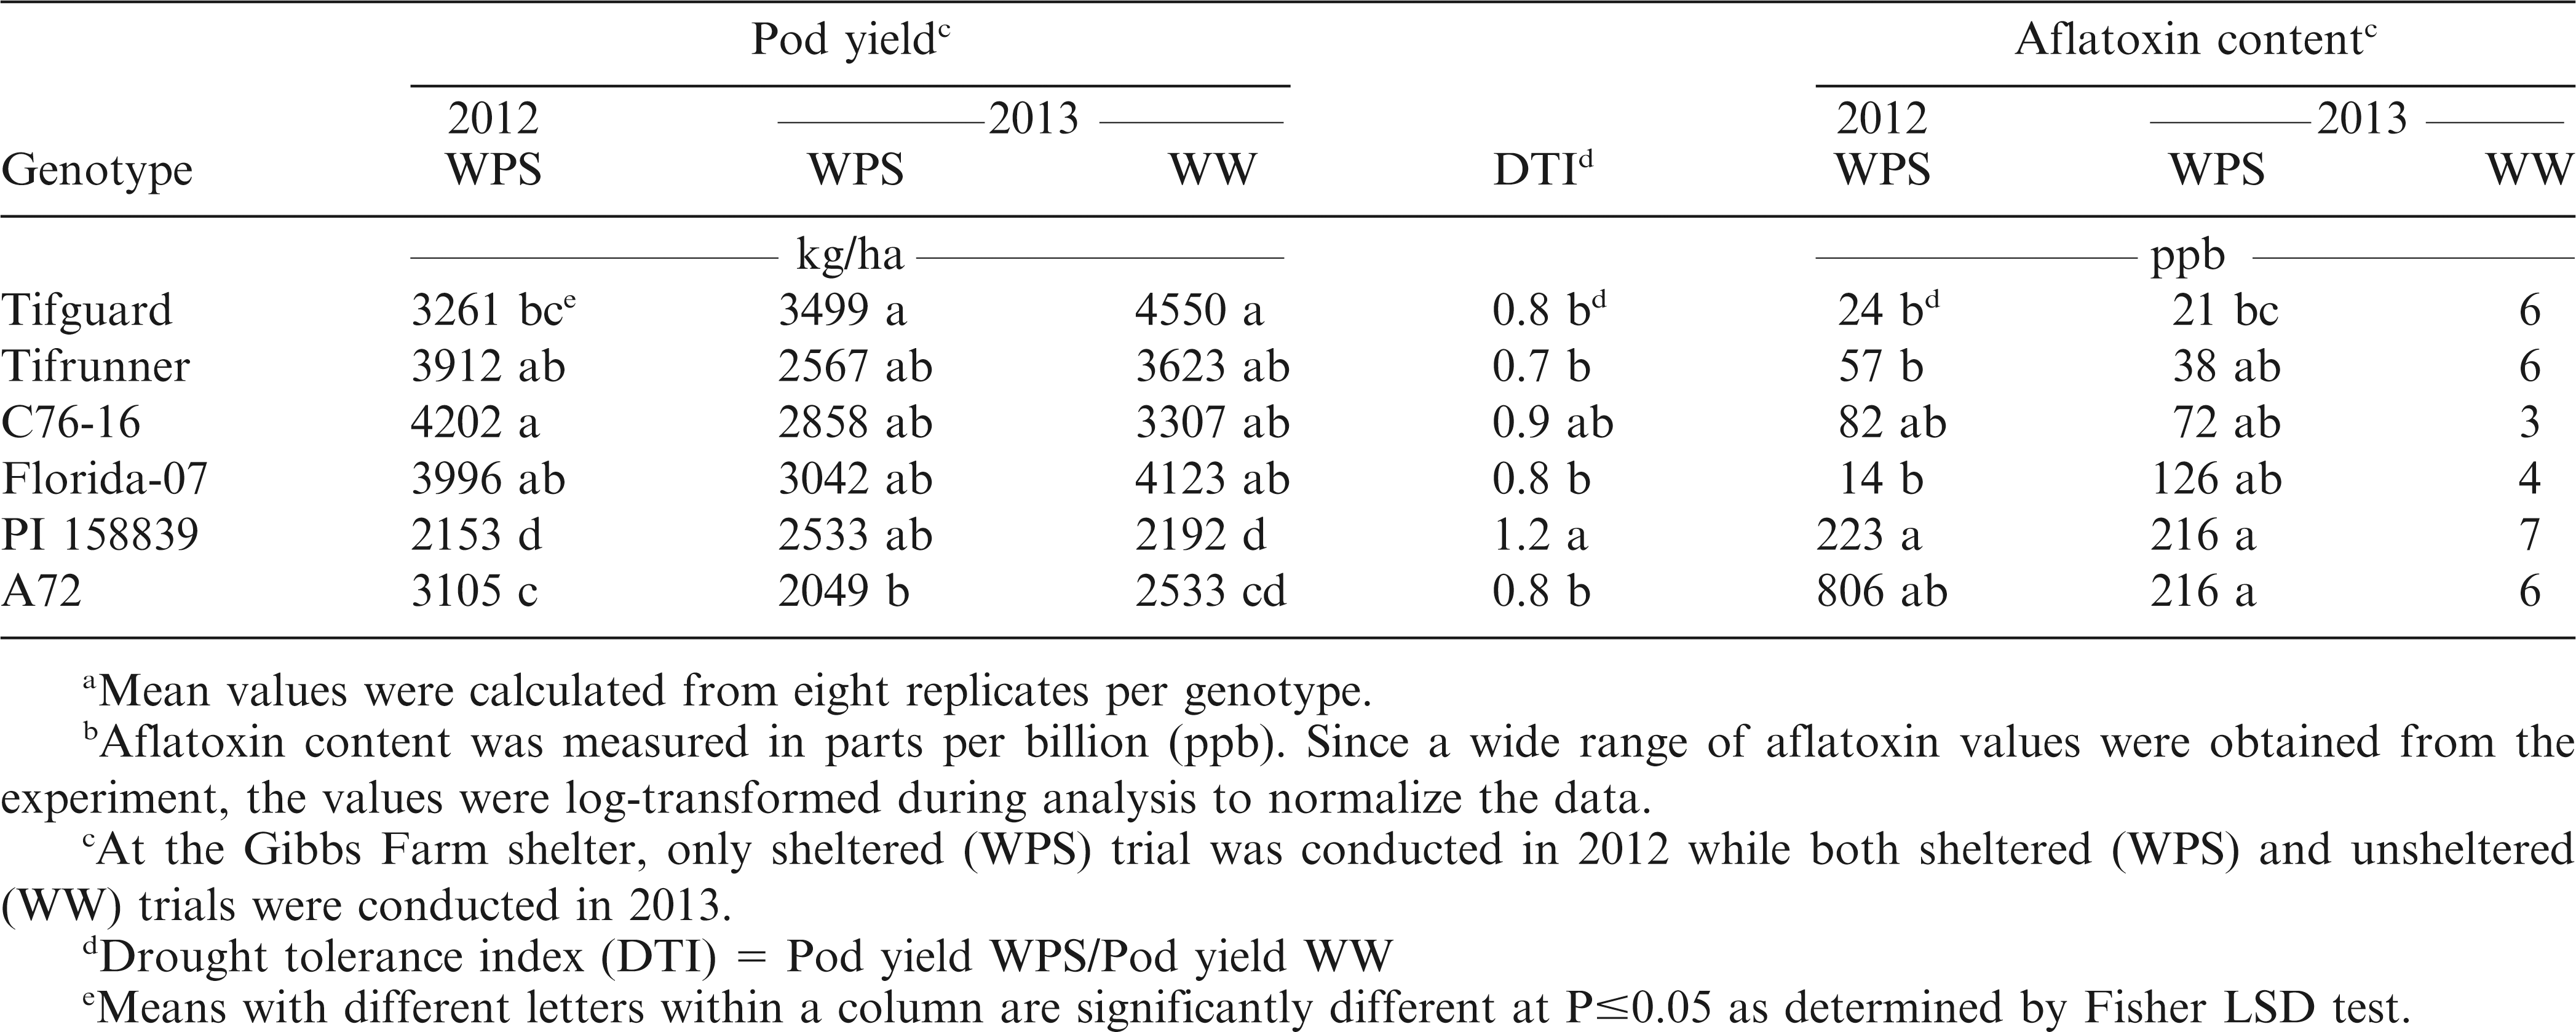
Mean pod yield (kg/ha)a and aflatoxin content (ppb) ab of the peanut genotypes harvested from the Gibbs Farm rainout shelter under whole plant stress (WPS) and well-watered (WW) conditions.
Aflatoxin contamination
A wide range of aflatoxin values were obtained from the plots (Table 6). Therefore, the aflatoxin data were log-transformed to normalize the data during analysis. In 2012, Tifguard, Tifrunner, and Florida-07 had the numerically lowest aflatoxin values. However, these were not significantly different from C76-16 and A72. In 2013, plants exposed to drought stress were observed to have higher aflatoxin contamination as compared to WW condition. This result is similar to the study of Reddy and Sulochanamma (2008) where aflatoxin contamination was higher in non-irrigated plants but was significantly reduced when irrigation was supplemented. Under WPS, Tifguard had aflatoxin contamination that was significantly lower than A72 but was not significantly different from Tifrunner, C76-16 and Florida-07. No significant differences were observed for aflatoxin contamination of the different genotypes under the WW condition.
Correlation analysis and interactions
All the evaluation methods used, except PIABS and φEO, produced significant correlations with aflatoxin contamination (Table 3). The correlations were positive for visual ratings and CT while correlations were negative for Fv/Fm, SCMR, CTD, NDVI, and pod yield. These results suggest that low visual ratings and CT as well as high Fv/Fm, SCMR, CTD, NDVI, and pod yield may be selected in breeding programs that aim to reduce pre-harvest aflatoxin contamination. The significant correlations between aflatoxin contamination with visual rating and leaf temperature (Holbrook et al., 2000), with SCMR and pod yield (Arunyanark et al., 2010), and with ground-based reflectance (Sullivan and Holbrook, 2007) had been reported in previous reports.
Significant correlations were also observed among the evaluation methods. This suggests the interrelatedness of these traits in the plant's mechanism for tolerating drought stress. The significant correlations between visual ratings and Fv/Fm, SCMR, CT, CTD, and NDVI indicate that the effect of drought on other plant physiological traits will likely affect the visual appearance of the plant. The positive correlations between Fv/Fm and all the other evaluation methods indicate that the photosynthetic efficiency of PSII is affected by the chlorophyll content (SCMR), CT, difference between CT and AT (CTD), and NDVI. Similar to the report of Shahen and Isoda (2010), SCMR had significant positive correlation with Fv/Fm and significant negative correlation with leaf temperature. This suggests that the decrease of chlorophyll content due to drought stress caused damage to PSII and was affected by high leaf temperature. There was positive correlation between SCMR and NDVI indicating that greater chlorophyll content is related to higher amount of green vegetation.
All the evaluation methods used in this study (visual ratings, chlorophyll fluorescence, SCMR, CT, CTD, NDVI, and pod yield) showed significant variation among genotypes in both rainout shelter locations suggesting differences in their sensitivity to detect differences in genotypic response to drought tolerance. Significant G × T effects were frequently obtained from the NESPAL shelter data indicating that the genotypes may behave differently depending on water conditions. This large G × T interaction has been reported to be very common in aflatoxin research and is acknowledged as the main reason for the inconsistent performance of peanut genotypes in response to aflatoxin contamination (Arunyanark et al., 2010). However, the responses of Tifguard, Tifrunner and A72 across water treatments were usually more uniform. On the other hand, the performance of C76-16, Florida-07, PI 158839 and NC 3033 showed variation in responses across water treatments and this may have been an important contribution to the significant G × T effects. The peanuts performed best under WW conditions while performing poorly under WPS due to the compounded effect of drought and heat stress in the pod and root zones of the plants. The plants subjected to PZS showed intermediate performance between WW and WPS demonstrating that drought tolerance in peanut is affected by available water in the pod zone despite the amount of available water in the root zone.
Phenotyping methods
Each evaluation method has its own advantages and disadvantages in the evaluation of drought stress. Visual rating offers an advantage over the other methods considering that no equipment is needed during plant evaluation. However, certain genotypes behaved differently in response to drought stress. Hence, the results can depend on the rater's subjective assessment of the crop status. The equipment used to measure chlorophyll fluorescence, SCMR, CT, CTD, and NDVI are light-weight, easy to use, rapid in giving measurements, and inexpensive. Yet, certain challenges were also faced using these methods. The evaluation of chlorophyll fluorescence required ratings before dawn, and thus, can be very challenging when measuring a large amount of genotypes or plant populations. Results from CT at the NESPAL shelter showed that both infrared thermometer and thermal imaging can be used effectively. The choice of device will be dependent on the amount of area to be measured and the availability of equipment. Using an infrared thermometer is simpler in that one can obtain a measure of CT immediately, whereas infrared images must be analyzed using specialized software at a later date. In contrast, infrared thermometer measurements must be taken quickly as a change in atmospheric factors over time can cause a change in the CT of the plants. Thermal imaging offers the advantage of taking an image and recording the CT measurements of several plant canopies in one shot, thereby eliminating variability in canopy temperature due to slight differences in time of measurement from one plot to the next. However, additional equipment and creative methods are needed to take images at an angle (usually above the plots) that can encompass the plants to be measured. The use of NDVI was very useful but can reflect various plant growth factors instead of exclusively reflecting the effect of one parameter, i.e. water availability (Govaerts and Verhulst, 2010). Nevertheless, although each evaluation method has its own advantages and disadvantages, the different methods also assessed different drought tolerance mechanisms of the plants. This reiterates the usefulness of combining several measurements as selection criteria for drought tolerance. However, combination of all these evaluation methods is beneficial but not always practical. In cases where one wants to choose initial methods for evaluation of drought tolerance in peanut genotypes, the combined use of (a) visual ratings (either taken in the morning if interested in permanent wilting, or taken in the afternoon if interested in the added effect of solar heat), (b) CTD (either via infrared thermometer or thermal imaging as both produced comparable results), and (c) NDVI is recommended.
Acknowledgements
This project was partially supported by the Agriculture and Food Research Initiative competitive grant 2012-85117-19435 of the USDA National Institute of Food and Agriculture.
Literature Cited
Amani I. Fischer R.A. and Reynolds M.P. 1996 Canopy temperature depression association with yield of irrigated spring wheat cultivars in hot climate J. Agron. Crop Sci. 176 : 119 - 129.
APC 2013 American Peanut Council: Peanut facts Available online from https://www.peanuts.usa.com. Accessed 29 Mar 2014 .
Appenroth K.J. Stockel J. Srivastava A. and Strasser R.J. 2001 Multiple effects of chromate on the photosynthetic apparatus of Spirodela polyrhiza as probed by OJIP chlorophyll a fluorescence measurements Environ. Pollut. 115 : 49 - 64 .
Arunyanark A. Jogloy S. Akkasaeng C. Vorasoot N. Kesmala T. Nageswara Rao R.C. Wright G.C. and Patanothai A. 2008 Chlorophyll stability is an indicator of drought tolerance in peanut J. Agron. Crop Sci. 119 : 113 - 125 .
Arunyanark A. Jogloy S. Wongkaew S. Akkasaeng C. Vorasoot N. Kesmala T. and Patanothai A. 2010 Heritability of aflatoxin resistance traits and correlation with drought tolerance traits in peanuts Field Crop Res. 117 : 258 - 264 .
Ayeneh A. van Ginkel M. Reynolds M.P. and Ammar K. 2002 Comparison of leaf, spike, peduncle and canopy temperature depression in wheat under heat stress Crop Res. 79 : 173 - 184 .
Bartels D. and Phillips J. 2010 Drought stress tolerance . In Kempken F. and Jung C. (eds), pp. 139 – 154 Genetic Modification of Plants: Agriculture , Horticulture and Forestry. Springer , Berlin, London .
Beute M.K. Wynne J.C. and Emery D.A. 1976 Registration of NC3033 peanut germplasm Crop Sci. 16 : 887 .
Bhagsari A.S. Brown R.H. and Schepers J.S. 1976 Effect of moisture stress on photosynthesis and some related physiological characteristics in peanuts Crop Sci. 16 : 712 - 715 .
Bjorkman O. and Demmig-Adams B. 1994 Regulation of photosynthetic light energy capture, conversion, and dissipation in leaves of higher plants, pp 14 – 47 . In Schulze E.D. and Caldwell M.M. (eds). Ecophysiology of Photosynthesis Springer, Berlin, Heidelberg .
Erickson P.I. and Ketring D.L. 1985 Evaluation of genotypes for resistance to water stress in situ Crop Sci. 25 : 870 - 876 .
FAOSTAT , 2013 Food and Agricultural Organization of the United Nations Statistics Division Available online from http://faostat3.fao.org. Accessed 23 Jan 2016 .
Fischer R.A. Rees D. Sayre K.D. Lu Z.M. Condon A.G. and Saavendra A.L. 1998 Wheat yield progress is associated with higher stomatal conductance, higher photosynthetic rate and cooler canopies Crop Sci. 38 : 1467 - 1475 .
Gorbet D.W. and Tillman B.L. 2008 Registration of ‘Florida-07’ peanut J. Plant Regist. 3 : 14 - 18 .
Govaerts B. and Verhulst N. 2010 The normalized difference vegetation index (NDVI) GreenSeeker™ handheld sensor: toward the integrated evaluation of crop management, pp 1-13. CIMMYT, Mexico .
Hamidou F. Rathore A. Waliyar F. and Vadez V. 2014 Although drought intensity increases aflatoxin contamination, drought tolerance does not lead to less aflatoxin contamination Field Crop Res. 156 : 103 - 110 .
Harrison K. 2012 Irrigation scheduling methods Cooperative Extension Bulletin 974 , 8 pp. The Univ. Georgia College of Agric. and Environ. Sci. , Tifton, GA .
Holbrook C.C. Anderson W.F. and Pittman R.W. 1993 Selection of a core collection from the U.S. germplasm collection of peanut Crop Sci. 33 : 859 - 861 .
Holbrook C.C. Kvien C.K. Rucker K.S. Wilson D.M. and Hook J.E. 2000 Preharvest aflatoxin contamination in drought tolerant and intolerant peanut genotypes Peanut Sci. 117 : 258 - 264 .
Holbrook C.C. Culbreath A.K. 2007 Registration of ‘Tifrunner’ peanut J. Plant Registr. 1 : 124.
Holbrook C.C. Timper P. Culbreath A.K. and Kvien C.K. 2008 Registration of ‘Tifguard’ peanut J. Plant Registr. 2 : 92 - 94 .
Holm A.M. Burnside D.G. and Mitchell A.A. 1987 The development of a system for monitoring trend in range condition in arid shrublands of Western Australia Aust. Rangeland J. 9 : 14 - 20 .
Horn B.W. 2005 Colonization of wounded peanut seeds by soil fungi: selectivity for species from Aspergillus section Flavi Mycologia 97 : 202 - 217 .
Horn B.W. and Pitt J.I. 1997 Yellow mold and aflatoxin , pp. 40 – 42 . In Kokalis-Burelle N. (ed). Compendium of Peanut Diseases , 2nd ed. APS Press , St. Paul, Minnesota .
Jackson R.D. 1982 Canopy temperature depression and crop water stress Adv. Irrig. 1 : 43 - 85 .
Jelinek C.F. Pohland A.E. and Wood G.E. 1989 Worldwide occurrence of mycotoxins in foods and feed - an update J. AOAC 72 : 223 - 230 .
Jongrungklang N. Toomsan B. Vorasoot N. Jogloy S. Kesmala T. and Patanothai A. 2008 Identification of peanut genotypes with high water use efficiency under drought stress conditions from peanut germplasm of diverse origins Asian J. Plant Sci. 7 : 628 - 638 .
Kambiranda D.M. Vasanthaiah H.K.N. Katam R. Ananga A. Basha S.M. and Naik K. 2011 Impact of drought stress on peanut (Arachis hypogaea L.) productivity and food safety , pp. 249 - 272 . In Vasanthaiah H. (ed). Plants and Environment Available online from OAlster Web, http://www.intech.open.com. Accessed 19 Jan 2014 .
Karimizadeh R. and Mohammadi M. 2011 Association of canopy temperature depression with yield of durum wheat genotypes under supplementary irrigated and rainfed conditions Aust. J. Crop Sci. 5 : 138 - 146 .
Koolachart R. Suriharn B. Jogloy S. Vorasoot N. Wongkaew S. Holbrook C.C. Jongrungklang N. Kesmala T. and Patanothai A. 2013 Relationship between physiological traits and yield components of peanut genotypes with different levels of terminal drought resistance SABRAO J. Breed. Genet. 45 : 422 - 446 .
Lepedus H. Brkic I. Cesar V. Jurkovic V. Antunovic J. Jambrovic A. Brkic J. and Simic D. 2012 Chlorophyll fluorescence analysis of photosynthetic performance in seven maize inbred lines under water-limited conditions Period. Biol. 114 : 73 - 76 .
Li L. Li X.Y. Xu X.W. Lin L.S. and Zeng F.J. 2013 Effects of high temperature on the chlorophyll a fluorescence of Alhagi sparsifolia at the southern Taklamakan Desert Acta Physiol. Plant. 36 : 243 - 249 .
Maxwell K. and Johnson G.N. 2000 Chlorophyll fluorescence - a practical guide J. Exp. Bot. 51 : 659 - 668 .
Nageswara Rao R.C. Talwar H.S. and Wright G.C. 2001 Rapid assessment of specific leaf area and leaf nitrogen in peanut (Arachis hypogaea L.) using a chlorophyll meter J. Agron. Crop Sci. 186 : 175 - 182 .
Nigam S.N. Chandra S. Sridevi K.R. Bhukta M. Reddy A.G.S. Rachaputi N.R. Wright G.C. Reddy P.V. Deshmukh M.P. Mathur R.K. Basu M.S. Vasundhara S. Varman P.V. and Nagda A.K. 2005 Efficiency of physiological trait-based and empirical selection approaches for drought tolerance in groundnut Annals. Appl. Biol. 146 : 433 - 439 .
Puangbut D. Jogloy S. Kesmala T. Vorasoot N. Akkasaeng C. Patanothai A. and Puppala N. 2011 Heritability of early season drought resistance traits and genotypic correlation of early season drought resistance and agronomic traits in peanut SABRAO J. Breed. Genet. 43 : 165 - 187 .
Reddy T.Y. and Sulochanamma B.N. 2008 Effect of minimal amount of supplemental irrigation during drought stress on yield and quality of groundnut Legume Res. 31 : 118 - 121.
Reddy T.Y. Reddy V.R. and Anbumozhi V. 2003 Physiological responses of groundnut (Arachis hypogea L.) to drought stress and its amelioration: a critical review Plant Growth Regul. 41 : 75 - 488 .
Shahenshah and Isoda A. 2010 Effects of water stress on leaf temperature and chlorophyll fluorescence parameters in cotton and peanut Plant Prod Sci 13 : 269 - 278 .
Sheshayee M.S. Bindumadhava H. Rachaputi N.R. Prasad T.G. Udayakumar M. Wright G.C. and Nigam S.N. 2006 Leaf chlorophyll concentration relates to transpiration efficiency in peanut Annals. of Appl. Biol. 148 : 7 - 15 .
Strasser R.J. Srivastava A. and Tsimilli-Michael M. 2000 The fluorescence transient as a tool to characterize and screen photosynthetic samples . In Yunus M. Pathre U. and Mohanty P. (eds) , pp. 443 - 480 Probing Photosynthesis: Mechanism, Regulation, and Adaptation Taylor and Francis , London .
Sullivan D.G. and Holbrook C.C. 2007 Using ground-based reflectance measurements as selection criterion for drought and aflatoxin resistant peanut genotypes Crop Sci. 47 : 423 - 432 .
Suthar D.M. and Patel M.S. 1992 Yield and nutrient absorption by groundnut and iron availability in soil as influenced by lime and soil water J. Indian Soc. Soil Sci. 40 : 594 - 596 .
Swindale L.D. 1989 A general overview of the problem of aflatoxin contamination of groundnut . In Mcdonald D. and Mehan V.K. (eds). Aflatoxin Contamination of Groundnut Proceedings of the International Workshop, ICRISAT Center , Patancheru, India, ICRISAT)
Tuberosa R. 2011 Phenotyping drought-stressed crops: key concepts, issues and approaches . In Monneveux P. and Ribaut J.M. (eds) , pp. 1 - 35 Drought Phenotyping in Crops: From Theory to Practice CGIAR Generation Challenge Programme , Texcoco, Mexico .
Turner N.C. O'Toole J.C. Cruz R.T. and Namuco O.S. 1986 Responses of seven diverse rice cultivars to water deficits I. Stress development, canopy temperature, leaf rolling and growth. Field Crop Res. 13 : 257 - 271 .
Underwood C.V. Taylor H.M. and Hoveland C.S. 1971 Soil physical factors affecting peanut pod development Agron J. 63 : 953 - 954 .
USDA 2013 U.S. Department of Agriculture - Agricultural Research Service 2013 National Agricultural Statistics Service. Peanut Area Planted and Harvested, Yield, and Production .
USDA 2009 US. Department of Agriculture - Agricultural Research Service National Nutrient Database for Standard Reference, Release 22 .
Weier J. and Herring D. 2000 Measuring Vegetation (NDVI & EVI) Available online from http://earthobservatory.nasa.gov/Features/MeasuringVegetation/. Accessed 30 Mar 2014 .
Will M.E. Holbrook C.C. and Wilson D.M. 1994 Evaluation of field inoculation techniques for screening peanut genotypes for reaction to preharvest A. flavus group infection and aflatoxin contamination Peanut Sci. 21 : 122 - 125 .
Wright G.C. Rao R.C.N. Basu M.S. and Passioura J.B. 1996 A physiological approach to the understanding of genotype by environment interactions - a case study on improvement of drought adaptation in groundnut . In Cooper M. and Hammer G.L. (eds) , pp. 365 - 380 Plant adaptation and crop improvement CAB International , Wallingford .
Notes
- Grad. Res. Asst., Dept. of Plant Pathology, University of Georgia, Tifton, GA 31794.
- Prof. of Horticulture and Director, Institute of Plant Breeding, Genetics & Genomics, University of Georgia, Tifton, GA 31794.
- Supervisory Res. Geneticist, Crop Genetics and Breeding Res., USDA, ARS, Tifton, GA 31794.
- Prof. and Extension Plant Pathologist, Dept. of Plant Pathology, University of Georgia, Tifton, GA 31794.
- Asst. Prof., Dept. of Crops and Soil Science, University of Georgia, Tifton, GA 31794.
- Post-doctoral Res. Assoc., Dept. Crops and Soil Science, University of Georgia, Tifton, GA 31794. *Corresponding author's e-mail: pmarian@uga.edu
Author Affiliations