

Introduction
The discovery of a naturally occurring high-oleic (HO) peanut mutant has resulted in the development of many cultivars where the oil has an oleic to linoleic acid (O/L) ratio of 9.0 or greater (Jung et al., 2000, Norden et al., 1987, O’Keefe et al., 1993). The high-oleic trait has been selected in the development of new cultivars because of the increased oxidative stability resulting from elevated levels of oleic acid and corresponding decreased levels of linoleic acid. This overall decrease in the levels of fatty acid unsaturation extends flavor stability during storage of peanuts and peanut containing products (Braddock et al., 1995). The major by-products of lipid oxidation lead to formation of off-flavors such as cardboardy and painty, which ultimately result in undesirable peanut flavor (Williams et al., 2006). Current industry concerns are centered on the prevalence of HO peanut lots contaminated with normal-oleic (NO) peanut seed. As HO peanuts provide increased shelf-life to value added products, it is important to understand the factors that may account for the presence of NO seeds in what should be purely HO lots. Physical mixing at any stage of seed handling has been shown to impact lot purity but changes in the unsaturation of fatty acids during peanut seed development have been reported (Sanders, 1980). The indeterminate flowering trait of the peanut is responsible for the range of pod maturities and seed sizes observed at peanut harvest. In normal peanut development, the seed rapidly accumulates carbohydrate and near mid-maturity, lipid accumulation becomes the dominant storage process (Ketring et al., 1982, Sanders et al., 1982). The study reported here describes the development of the O/L ratio in NO and HO seed for both virginia- and runner-type cultivars as a function of individual seed fresh weight in order to document the physiological expression of the HO trait over the course of peanut seed growth.
Materials and Methods
Plant Material
Peanut plants from certified seed lots of the virginia-type NO cultivar, ‘Bailey’ (Isleib et al., 2009) and the virginia- type HO cultivar, ‘Spain’ (Tillman and Gorbet, 2012) were planted during the 2012 growing season at the North Carolina State University Research Station in Rocky Mount, North Carolina, USA. Seeds were planted mechanically in prepared fields that had not previously been planted with peanuts for at least 4 years. At a period beginning at 9 weeks, that is 65 days after planting (DAP), 5 plants of each cultivar were hand dug from the plots. This sampling protocol was repeated each week thereafter, for a total of 12 weeks, until the normal harvest date (148 DAP). A subset of three sampling dates (78 DAP, 106 DAP, 148 DAP) was chosen for analysis to represent an early, mid, and late portion of the growing season. After hand digging, soil was removed from the plants by shaking and rinsing with tap water and pods were then removed from the plants by hand to ensure that pods from each plant were kept separate. Pods were stored at 2 C and allowed to equilibrate overnight prior to analysis at the Market Quality and Handling Research Unit (MQHRU) in Raleigh, North Carolina, USA. Each pod from each plant was weighed, opened using a razor blade and the seeds inside were removed, weighed, and transferred to individual screw-capped plastic culture tubes and stored at −15 C until analyzed. Each tube was given a unique sample number for later identification.
Peanut plants from certified seed lots of the runner-type NO cultivar ‘Tifguard’ (Holbrook et al., 2008) and breeder seed of the line ‘C68-17’ were planted at the Gibbs Farm in Tift County, Georgia, USA during the 2013 growing season. ‘C68-17’ is a near isogenic line of Tifguard. It was generated through three rounds of accelerated backcrossing using molecular markers for nematode resistance and the high-oleic trait (Chu et al., 2011). ‘Florida-07’ (Gorbet and Tillman, 2009) was the donor parent for the high-oleic trait in C68-17. Seeds were planted at a rate of six seed per foot in two row plots that were 15 feet long. Five complete, intact plants from each cultivar were selected at three dates; 82 DAP, 115 DAP, and 158 DAP. After hand digging, the plants were gently shaken to remove loose dirt, packed individually into plastic food storage bags, and shipped overnight to the MQHRU. All pods were removed from the individual plants by hand and stored and processed at the MQHRU in the same manner described above for virginia-type cultivars grown in 2012.
Fatty Acid Determination
Individual peanut seed from individual pods from individual plants were evaluated for fatty acid profiles (FAP) at 78 DAP, 106 DAP and 148 DAP for the virginia-type cultivars, and 82 DAP, 115 DAP, and 158 DAP for runner-type cultivars as described in Zeile, et al. (1993). In brief, a hollow needle was used to remove a sample from each seed by pushing it through the center of the seed and completely through each cotyledon to ensure an entire core was taken. The needle was a modified from a Spalding sports ball inflation needle (Russell Brands, Bowling Green, KY) by cutting off the rounded end to produce a needle that was 1mm in diameter and 5 mm in length. The screw end was mounted in a rubber stopper for ease of handling. The sample (0.01 to 0.15 g) was transferred to a 17 mm by 100 mm glass culture tube fitted with a Teflon lined screw cap (Corning Glassworks, Corning, NY). If necessary, the sample was then physically crushed before methylation. Samples were directly methylated to their respective fatty acid methyl esters as describe previously (Dean et al., 2009). Samples were incubated at 85 C for 5 min after the addition of 1 mL of a solution of 0.5 N NaOH (ACS grade, Thermo Fisher, Fairlawn, NJ) in methanol (Optima grade, Thermo Fisher). After cooling slightly, 1 mL of boron trifluoride solution (14% in methanol, Sigma Chemical Corp., St. Louis, MO) was then added and the samples were incubated for an additional 10 min. The tubes were then equilibrated to room temperature and 1 mL of water followed by 1 mL of hexane (Optima grade, Thermo Fisher) were added and the tubes were vortexed to mix. Two layers formed and the top (organic) layer, containing the fatty acid methyl esters, was transferred to a clean culture tube containing a few grains of sodium sulfate (Sigma) to remove any water. The solvent was then transferred to a crimp top glass autosampler vials (Agilent Technologies, Santa Clara, CA) for analysis.
Fatty acid methyl esters were analyzed by GC using a Perkin Elmer Clarus 500 system (Perkin Elmer, Shelton, CN). The column used was a 70% cyanopropyl polysilphenylene-siloxane SGE BPX70, 30 m length and 0.25 mm i.d. with 0.25 micron film (SGE Analytical Science, Austin, TX). The temperature program was 60 C with a 2 min hold time, increased at 10 C per min to 180 C with no hold time and then increased at 4 C to 235 C for a total run time of 27.7 min. The carrier gas was helium at a flow rate of 1.85 mL/min with a split injection flow of 40 mL/min. The detection was flame ionization. The injector temperature was 220 C and the detector temperature was 250 C. A standard mixture of authentic fatty acid methyl esters (Kel Fir FAME 5, Matreya, LLC, State College, PA) was run to establish retention times with each sample set. The fatty acid composition of each sample was calculated and normalized according to AOCS Official Method Ce 1h-05 (2005). This method allows for description of the fatty acid composition of the peanut lipids in terms of percent (%) of each fatty acid of the total fatty acids present.
Results and Discussion
Virginia-type cultivars
The pods of peanuts are formed over a period of time due to the indeterminate growth habit of the peanut plant and therefore weekly samplings beginning 65 DAP and continuing until 148 DAP produced a range of pod and seed fresh weights for both NO and HO cultivars. To make the study more manageable, data presented here are only for the first (65 DAP for virginia-type, 71 DAP for runner-type), mid-point (115 DAP for virginia-type, 106 DAP for runner-type) and harvest date (148 DAP for virginia-type, 158 for runner-type) samplings. Pod weight and seed weight have been shown to increase as the growing season progresses (Pattee et al., 1977, Sanders et al., 1982, McNeill and Sanders, 1996). Bailey is a medium to large-seeded virginia-type peanut and ‘Spain’ is a virginia-type that has very large pods. Bailey pods had grown to 4.0 to 5.0 g by 71 DAP, the maximum pod weight observed throughout sampling. For Spain, the largest pods were in the range of 7.5 to 8.5 g by 71 DAP and then increased to 8.5 to 9.5 g by 134 DAP. McNeill and Sanders (1996) reported increases in pod weights to maximum size before anticipated harvest date. The seed fresh weights from Bailey increased over the sampling dates to a maximum near 1.8 g. Spain seed fresh weights increased over the sampling dates to 2.5 to 3.0 g by 120 DAP and with only minimal increases by 148 DAP. The variability of pod and seed sizes obtained demonstrated that throughout the growing season, seeds at various stages of physiological development were present. The changes in seed fresh weights relative to physiological maturity are supported by the work of Sanders (1989) who documented a general relationship between seed size and maturity, with larger seed categories containing a greater percentage of mature seed than smaller seed categories. Despite this general relationship, Sanders (1989) presented the caveat that larger commercial seed size categories may also contain substantial amounts of immature peanuts because peanuts tend to obtain maximum size before they reach maximum maturity. The work of Butts and Smith (1995) demonstrated that peanut shrinkage does occur during storage but that the moisture loss does not have a significant impact on the commercial size of the peanut. Considering the results of these two reports, the use of seed fresh weight in the study presented here is generally related to both seed size and physiological seed maturity.
The FAP of each individual seed (n = 1618) from each individual plant was determined from the plants collected 78 DAP, 106 DAP, and 148 DAP. These sampling times allowed for a progressive evaluation of fatty acid changes on an individual seed basis as the growing season progressed (Figures 1, 2 and 3). As previously presented in the literature, oleic and linoleic acid have an inverse relationship during peanut development (Andersen et al., 1998). At the earliest sampling (78 DAP), Spain seeds had increased levels of oleic acid compared to Bailey seeds with oleic acid as a percent of the total fatty acids ranging between 30.7 to 65.0% as opposed to 17.9 to 40.4% respectively (Figure 1). At the middle sampling date (106 DAP), oleic acid content had increased for both the Bailey and Spain cultivars and the levels began to plateau with increasing seed fresh weight. At this time point, the oleic acid (%) increase with increasing seed fresh weight in the Spain cultivar appeared as two distinct groups; ca. 50.0 to 60.0% and 70.0 to 83.7%. Correspondingly, the linoleic acid levels decreased showing two groups as well (Figure 2). Using a threshold of 74% oleic acid and correspondingly 9% linoleic (which would produce an O/L ratio of 9.0) as the defining values between HO and NO seeds, this division is of significance. Examination of the contribution of seeds from each of the individual plants to the two distinct groups observed revealed that, the NO seed present were not all from a single plant. However it did appear that one plant at 106 DAP had mainly NO seed and fewer HO seed. By the final sampling (148 DAP), oleic acid levels measured in seeds taken from the final sampling had not increased from the levels of the second sampling (106 DAP) for either Bailey or Spain seeds. Additionally, the two distinct ranges of oleic acid concentration observed in the Spain cultivar at 106 DAP persisted at 148 DAP and once again all of the NO seed observed were primarily, but not all from a single plant. The exact cause of this is unknown, but it is possible this was due to outcrossing and/or an NO seed contaminating the lot of seed planted. The linoleic acid development was seen to inversely reflect the oleic acid development for both cultivars (Figure 2). Beginning 78 DAP, linoleic acid levels were higher in the Bailey cultivar (35.6 to 49.3%) than the Spain cultivar (16.2 to 36.6%). As the growing season progressed, linoleic acid content had decreased for both cultivars; Bailey between <0.1 to 49.9% and Spain split into two groups, <0.1 to 10.0% and 20 to 49.3%. Linoleic acid levels were similar in the second and final sampling. The inverse developmental relationship observed between oleic and linoleic acid indicates that in order for oleic acid to develop, the linoleic acid fraction must decrease. This relationship results from these two fatty acids being the main acyl groups in the oil where the proportion of one fatty acid cannot greatly increase without a decrease in the other (Hammond et al., 1997). Additionally, for the NO Bailey cultivar, linoleic acid comprised a greater proportion of the seed lipid early in development (78 DAP) yet in later stages of development (106 and 148 DAP), oleic acid levels were greater than linoleic. The shifting from linoleic acid as the most abundant fatty acid to oleic acid as most abundant in Bailey seeds suggests that either the enzyme oleate desaturase is more active in the earliest stages of development or that the amount of oleic acid synthesized later in development occurs at a rate faster than the rate of conversion by the enzyme (Jung et al., 2000). In the HO Spain cultivar, oleic acid is the most abundant fatty acid throughout development although levels increase as the development progresses. The two distinct oleic and linoleic acid content groupings observed on and after 106 DAP demonstrate that seeds of equivalent fresh weight can have different fatty acid compositions. The exact mechanisms explaining these findings are unclear, but could be attributed to contamination with NO seed in the HO seed lot, outcrossing, and/or incomplete breeding segregation as discussed at greater length later.
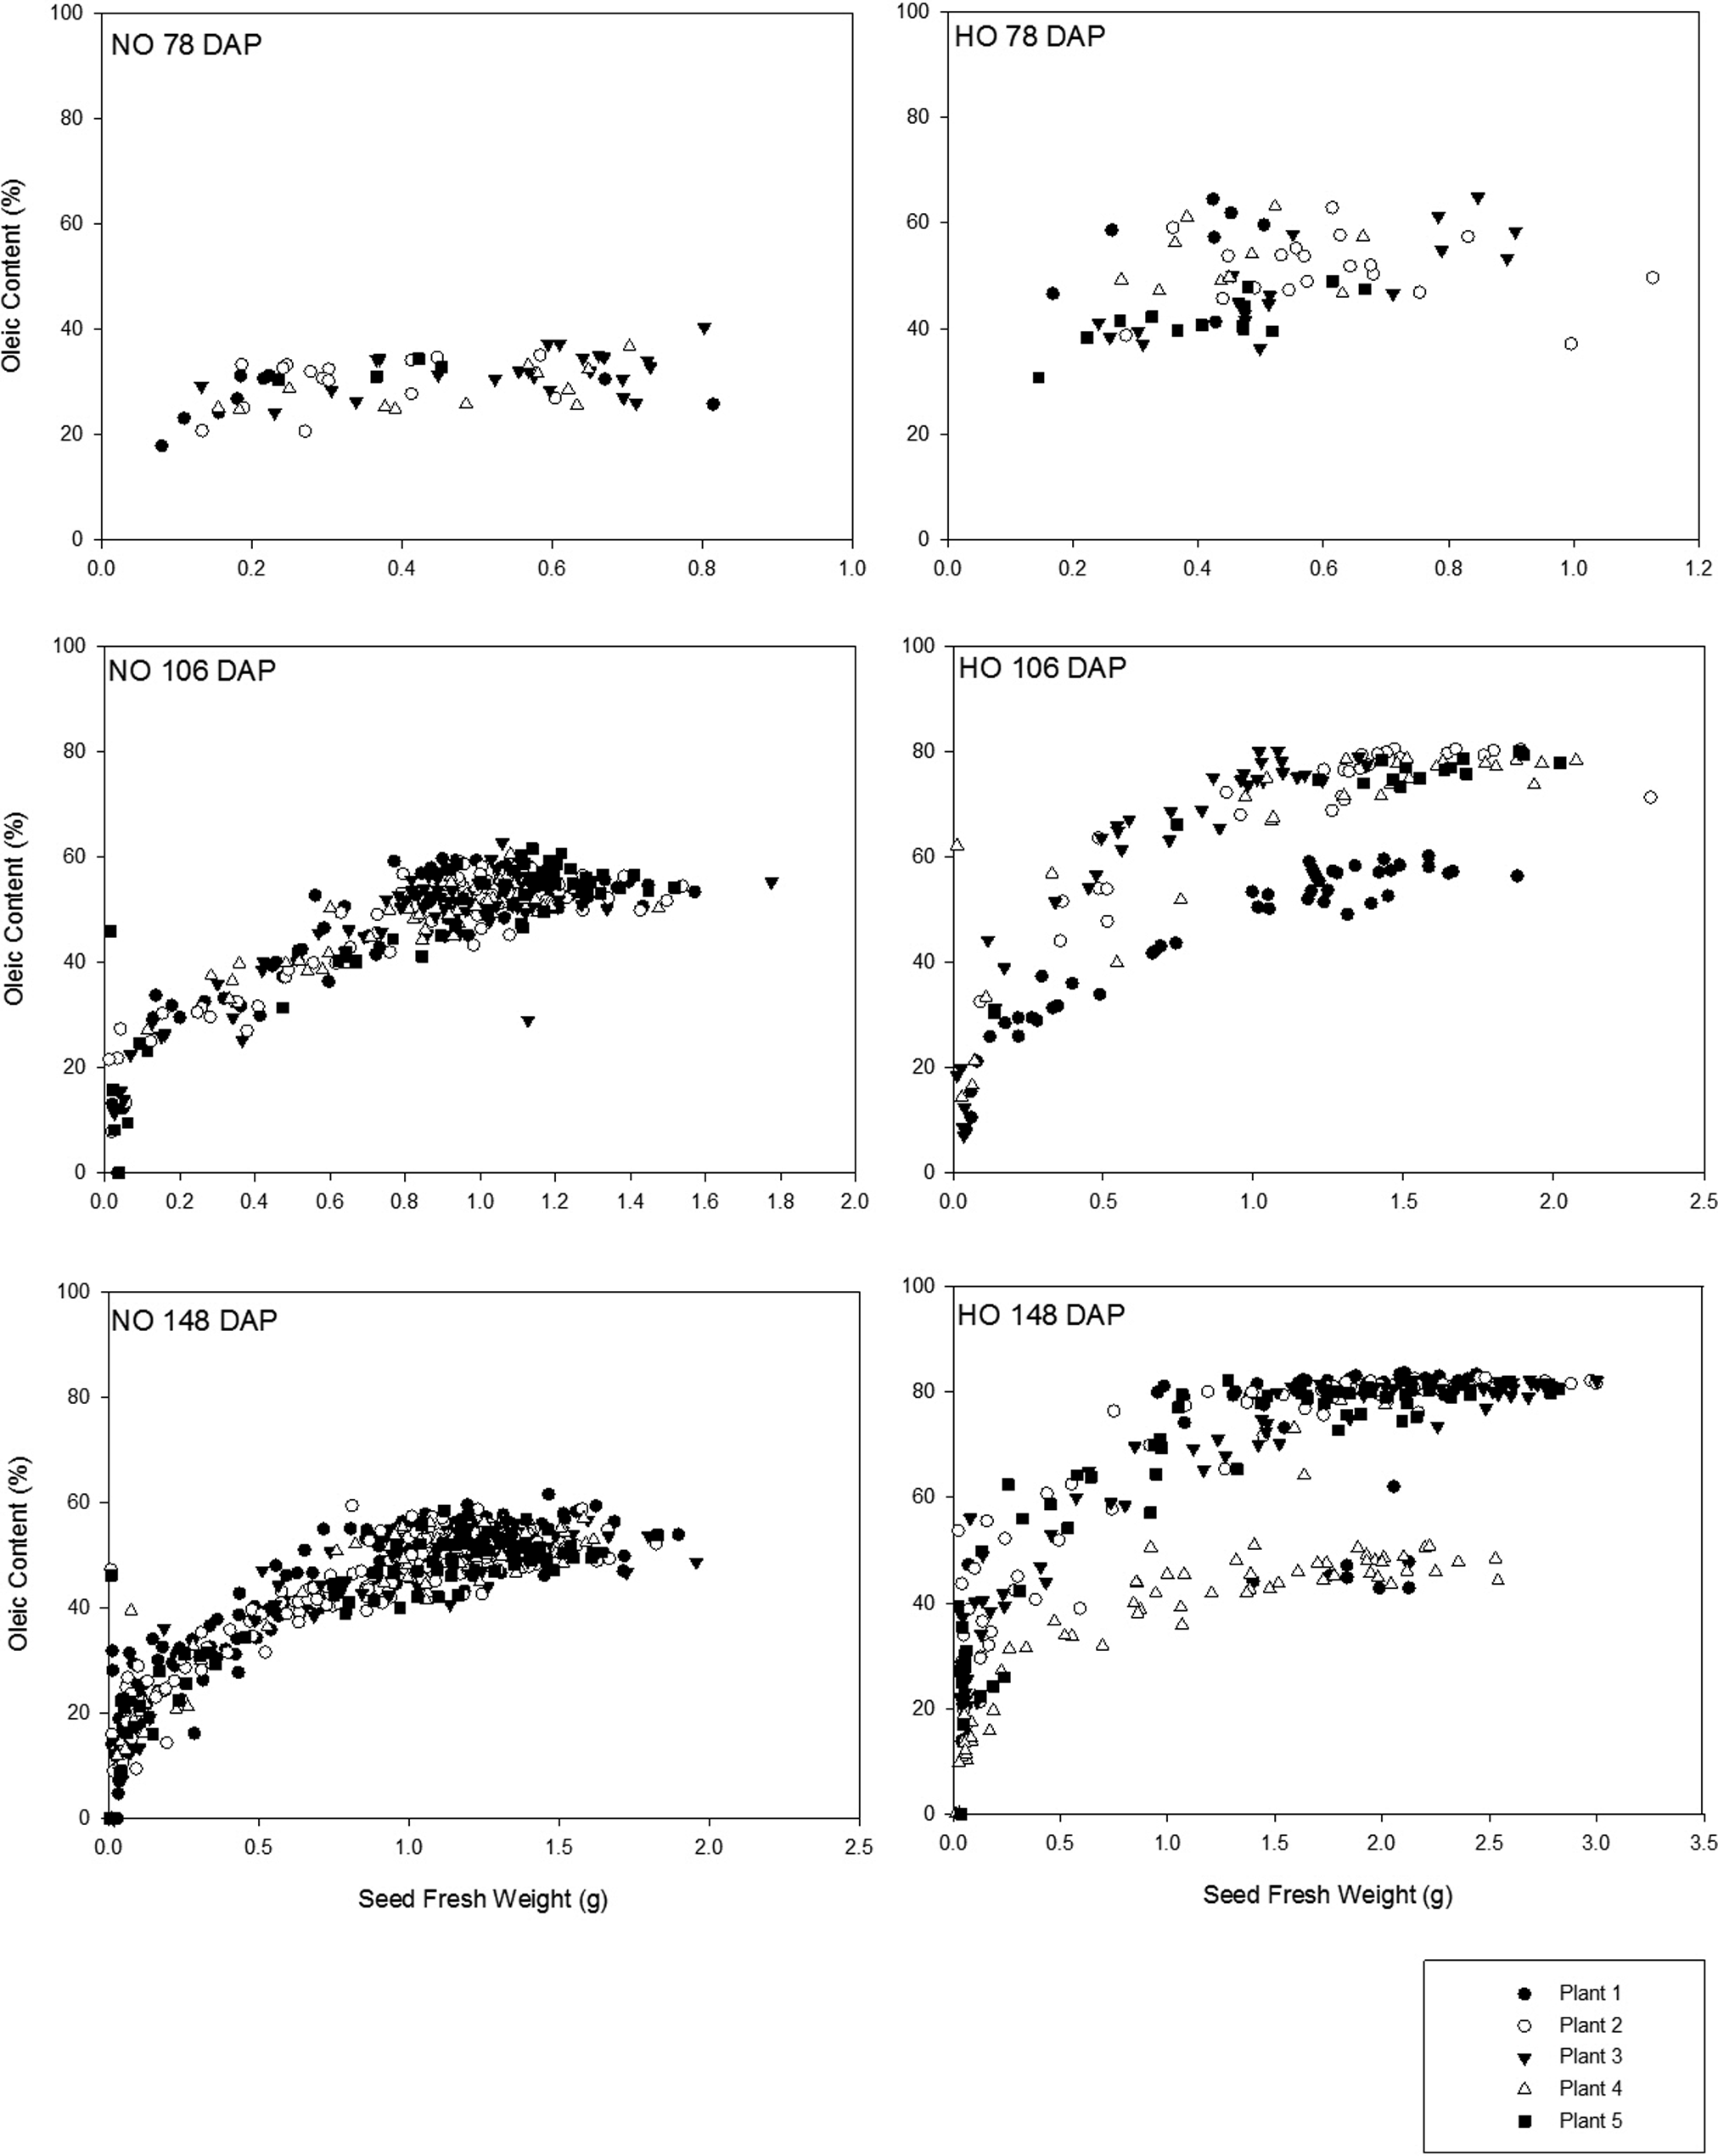
Development of oleic acid (%) with increasing seed weight (g) in Bailey (NO = normal oleic) and Spain (HO = high oleic) virginia-type cultivars over early (78 DAP = days after planting), middle (106 DAP), and late (148 DAP) sampling dates.
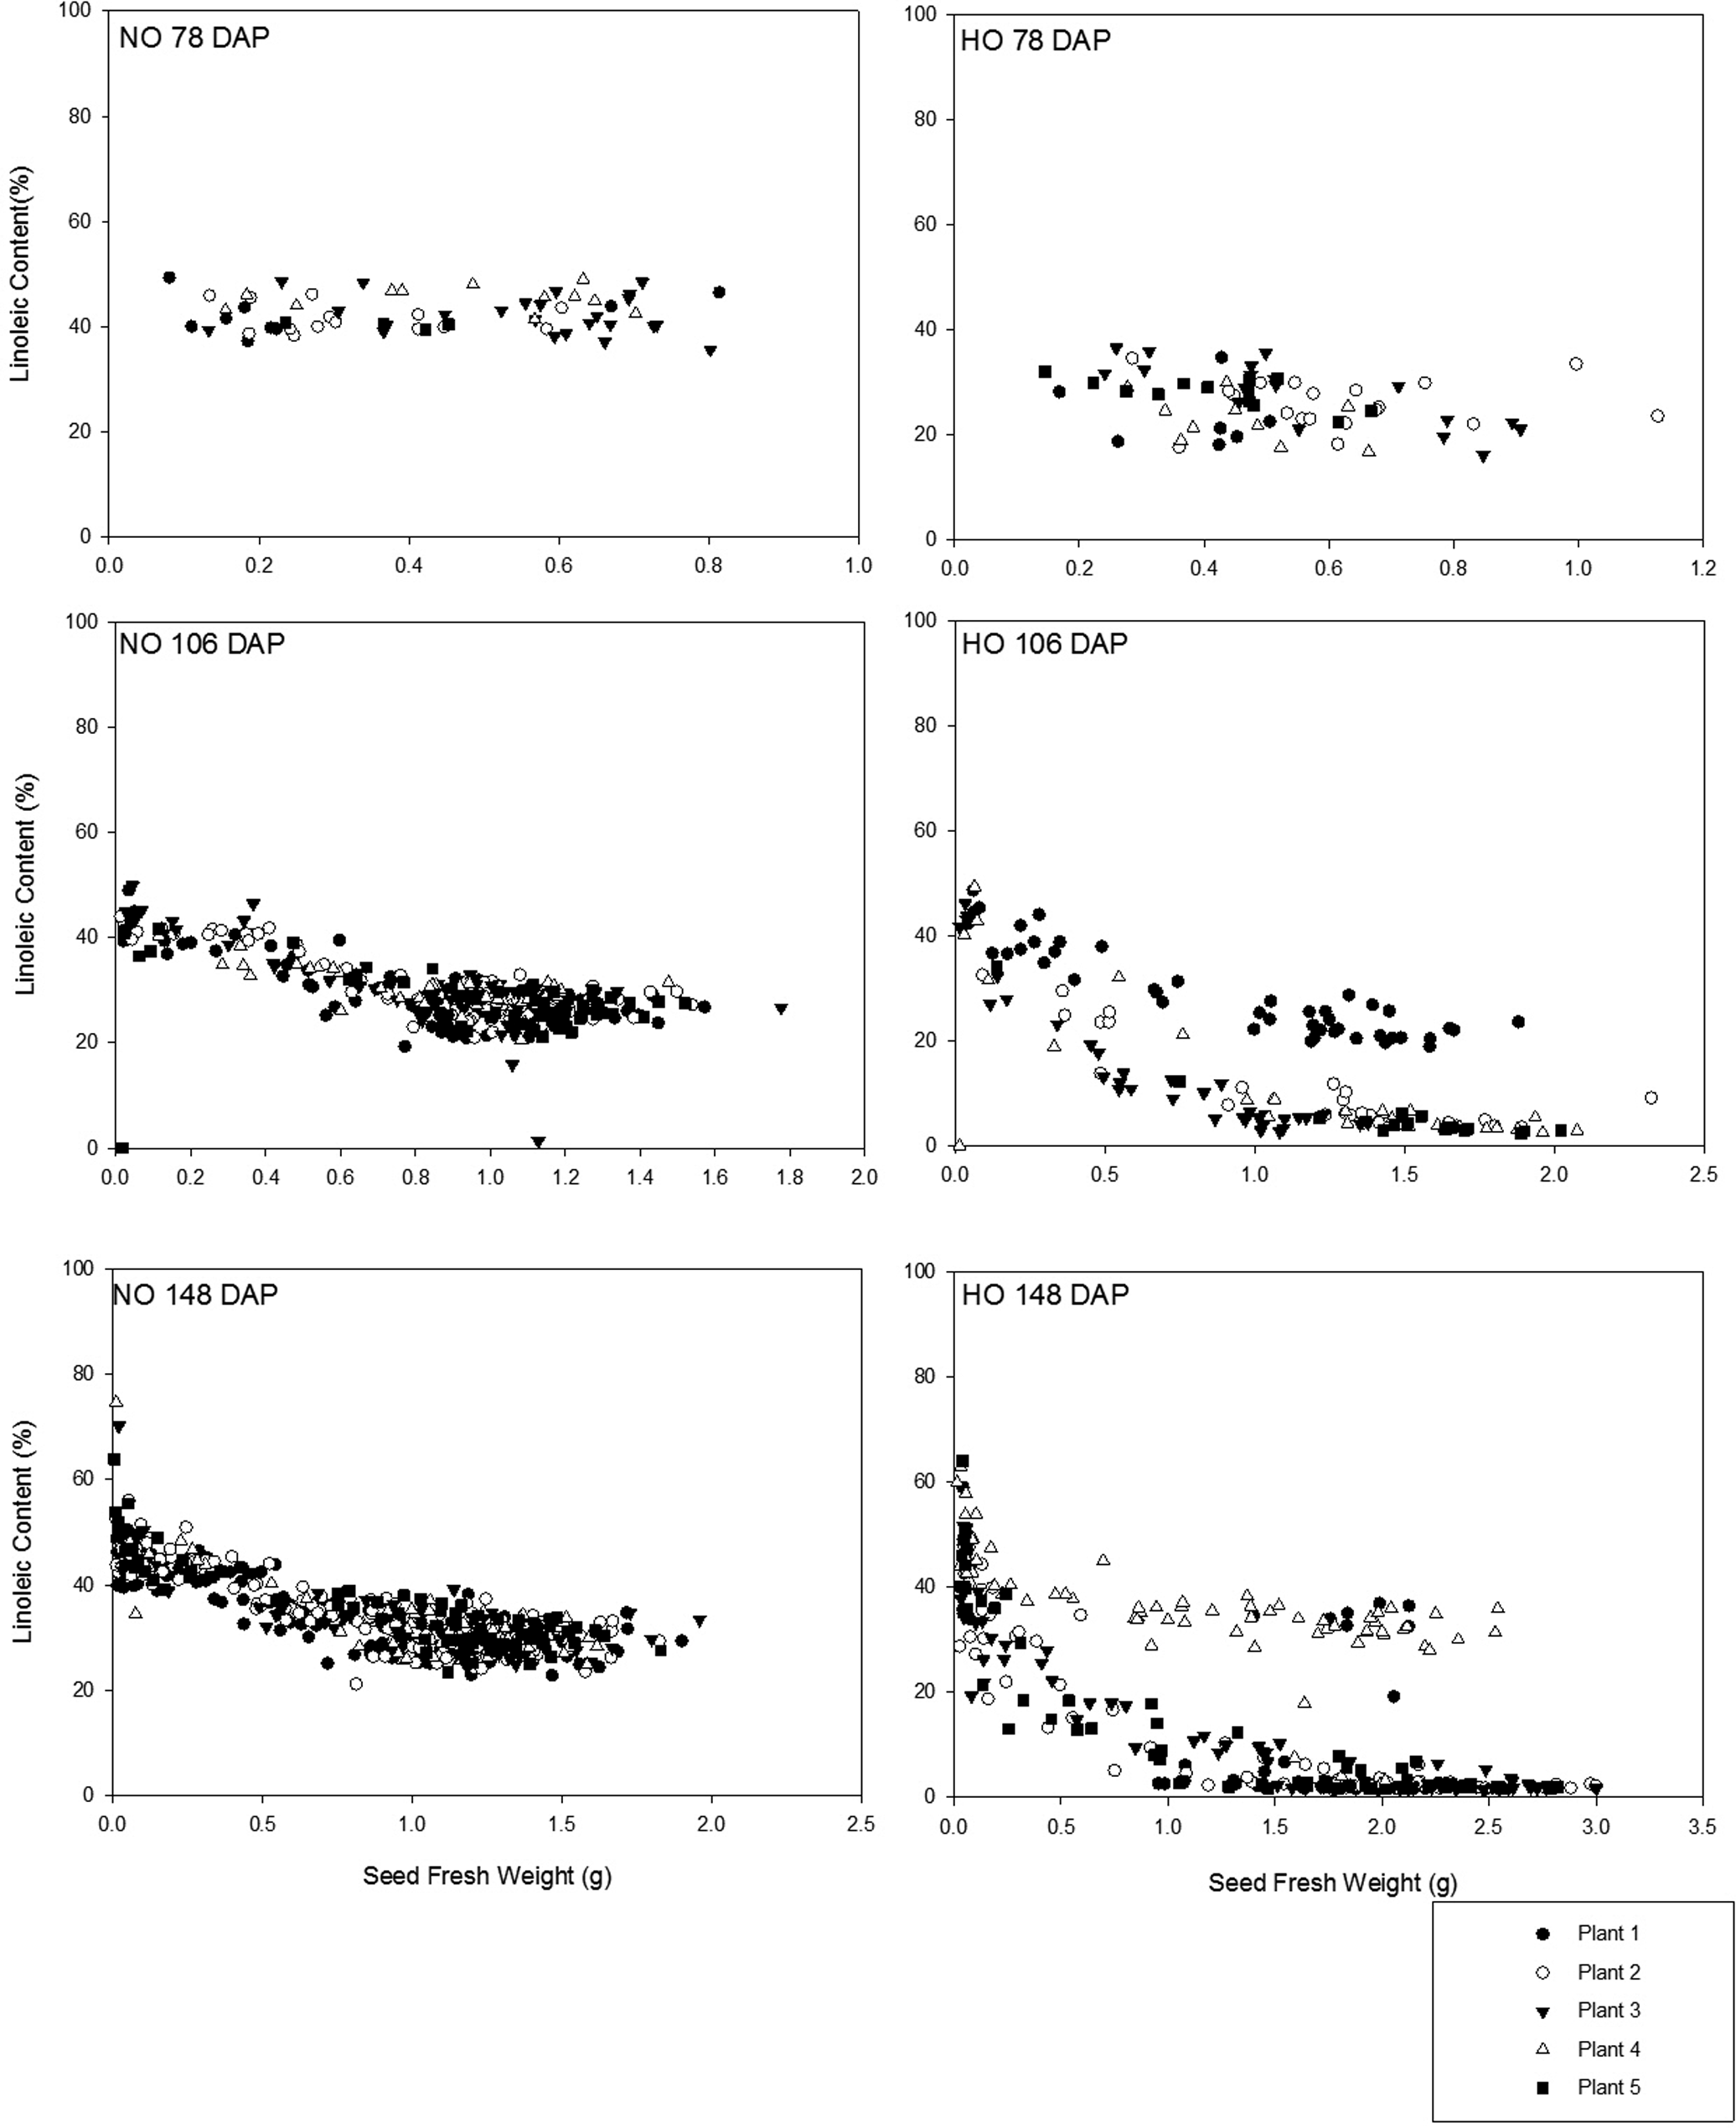
Development of linoleic acid (%) with increasing seed weight (g) in Bailey (NO = normal oleic) and Spain (HO = high oleic) virginia-type cultivars over early (78 DAP = days after planting), middle (106 DAP), and late (148 DAP) sampling dates.
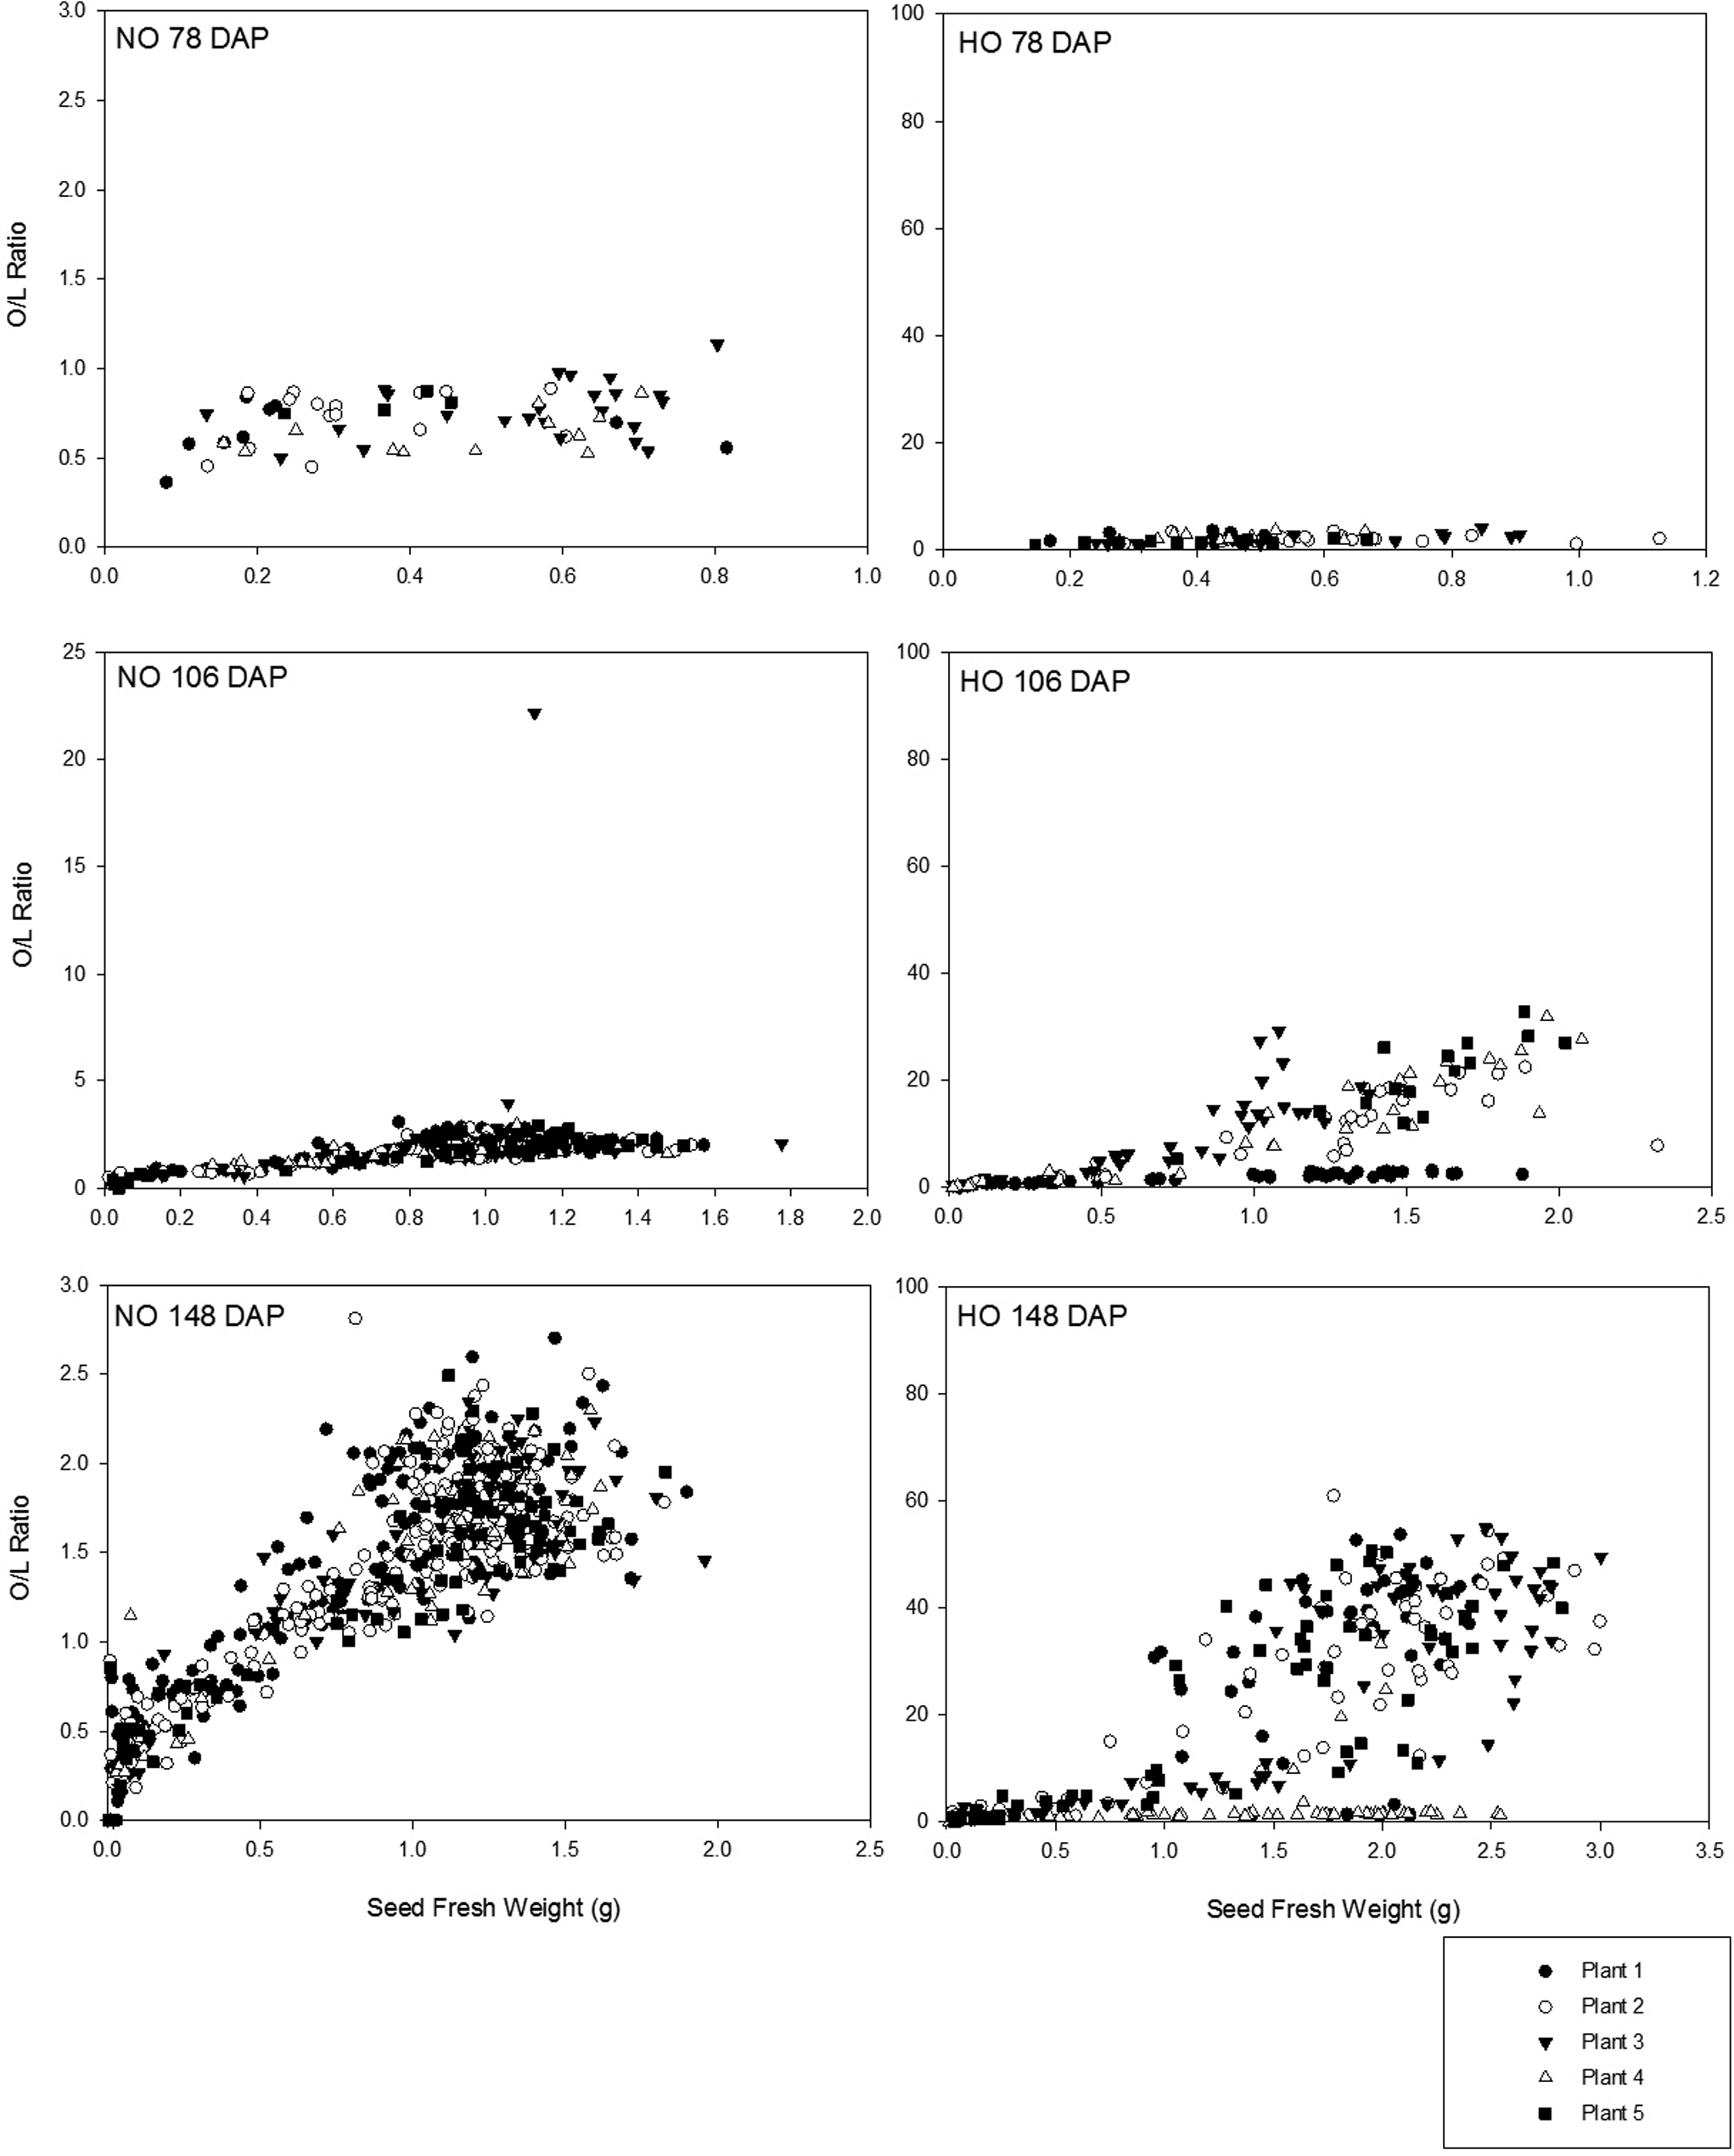
O/L (oleic to linoleic) ratio development in Bailey (NO = normal oleic) and Spain (HO = high oleic) virginia-type cultivars over early (78 DAP = days after planting), middle (106 DAP), and late (148 DAP) sampling dates. Scales have been optimized for the NO data.
The most common way to describe and distinguish cultivars with different fatty acid levels is to use the oleic to linoleic ratio (O/L). This is calculated by dividing the % oleic acid by the % linoleic acid present. As previously mentioned, cultivars with O/L values above 9.0 are considered to be HO. At the first sampling, 78 DAP, little variability in O/L ratio was observed for either the Bailey or Spain cultivar with mean O/L ratios of 0.72 (± 0.15) and 2.0 (± 0.76), respectively (Figure 3). In agreement with the results previously presented in this study for seed development of oleic acid (%) and linoleic acid (%) (Figures 1 and 2), the range of values of O/L ratios observed increased as the growing season progressed as illustrated by Figure 3. By 106 DAP, Bailey seeds were still consistent with a mean O/L ratio of 1.60 (± 1.02) yet a broader range of mean O/L ratios was observed among Spain seeds (9.10 (± 8.80)). As the fresh seed weight values observed for Spain seeds increased, the O/L ratio increased; however, for nearly equivalent fresh weight seeds, a range of O/L ratios was observed. While the presence of some NO seed was the cause of some of the variation, the effect of seed fresh weight influenced the range of O/L ratios seen. This was illustrated by seeds of the same fresh weight that had NO as well as HO O/L ratios traceable to the same plant. Some of this discrepancy in O/L ratios with seed fresh weight is likely due to the phenomenon that rapid accumulation of lipid approaching the maximum content for the seed occurs only after the seed has increased significantly in size (Schenk, 1961). This problem is linked to the recurring presence of physiologically immature seed which are the same commercial size as their mature counterparts (Sanders, 1989). At the final sampling 148 DAP, 50.8% of Spain seeds had O/L ratios below the threshold of 9.0 with a range of seed fresh weights of 0.01 to 2.51 g. A closer examination of the data reveals all seeds from all plants sampled at the final sampling 148 DAP produced a range of O/L ratios even for seeds from the same plant (Figure 3). Based upon the range of O/L ratios among seeds of the same fresh weight it was observed that O/L ratios cannot be consistently predicted based on seed fresh weight, although increasing seed weight was more often associated with increasing O/L. This was previously report-ed among large-seeded virginia cultivars where a strong relationship exists between the size and maturity of the pod and fancy pods have been shown to have a greater percentage of small seed (McNeill and Sanders, 1996). Delayed lipid accumulation in large-seeded virginia-type cultivars is evidenced in this study by the lack of HO seeds at the early sampling date (78 DAP) of the growing season. The range of O/L ratios observed throughout the growing season and among seeds of the same size and from the same plant indicated that the O/L ratio developed throughout the growing season and therefore challenges exist with obtaining purely HO lots as seed of various physiological stages of development are present at harvest, including some peanuts not fully expressing an oil chemistry meeting industry thresholds for HO peanuts, that is O/L values greater than 9.0. High purity HO lots are of extra importance in products where single whole peanuts are consumed. In homogeneous products, such as peanut butter, the lipid profile and oxidation potential from seed to seed variation is less apparent. In peanut products consumed on a seed to seed basis, a single seed is readily noticed by consumers if it is rancid when other nuts in the same package are not.
Runner-type cultivars
Investigation of the development of FAP of individual seed (n = 1021) in related runner-type cultivars, Tifguard (NO) and C68-17 (HO), allowed for comparison to the trends observed in virginia-type cultivars. Oleic acid was the most abundant fatty acid in both the Tifguard and C68-17 cultivars at 82 DAP, 115 DAP, and 158 DAP when comparing Figures 4 and 5. At 82 DAP, the oleic acid content was between 40.0-60.0% of the total fatty acids for the Tifguard seed and increased to 40.0-71.4% by 115 DAP, with little change at 158 DAP. In the C68-17 seed, the range of oleic acid concentrations was larger with initial levels measured between 60.0 to 82.3% at 82 DAP. By 115 DAP, oleic acid appeared as two fractions, 40.0 to 60.0% and 70.0 to 84.7%, for the C68-17 seed. These two distinct groupings at this sampling time were the result of one plant which produced only NO seed. By the final sampling time, 158 DAP, oleic acid content in the C68-17 seed was observed in a consistent range of 80.0 to 85.6% (Figure 4). Linoleic acid content was within the range of 15.0 to 65.2% for Tifguard seed as the growing season progressed (Figure 5). Higher concentrations of linoleic acid were observed in Tifguard seeds of lower seed fresh weights. At 82 DAP, linoleic acid content for C68-17 seeds was seen as two groups, <0.1 to 15.0% and 30.0 to 61.0%. Seeds with linoleic acid content within the range of 0.0-15.0% had fresh seed weights greater than 0.5 g. C68-17 seeds with fresh weights less than 0.5 g fell into the higher range, 30.0 to 61.0%, of linoleic acid content. At 115 DAP, linoleic acid content appeared in groupings of 1.3 to 10.0% and 20.0 to 45.6%. Additionally, linoleic acid content within the 1.3 to 10.0% range was not observed in seeds with fresh weights less than 0.5 g (Figure 5). At the final sampling (158 DAP), linoleic acid content in C68-17 seeds was consistent within the range of 1.4 to 34.3%, even though there are many more sample points than at the other sampling times due the larger number of seeds present on the plants at this stage.
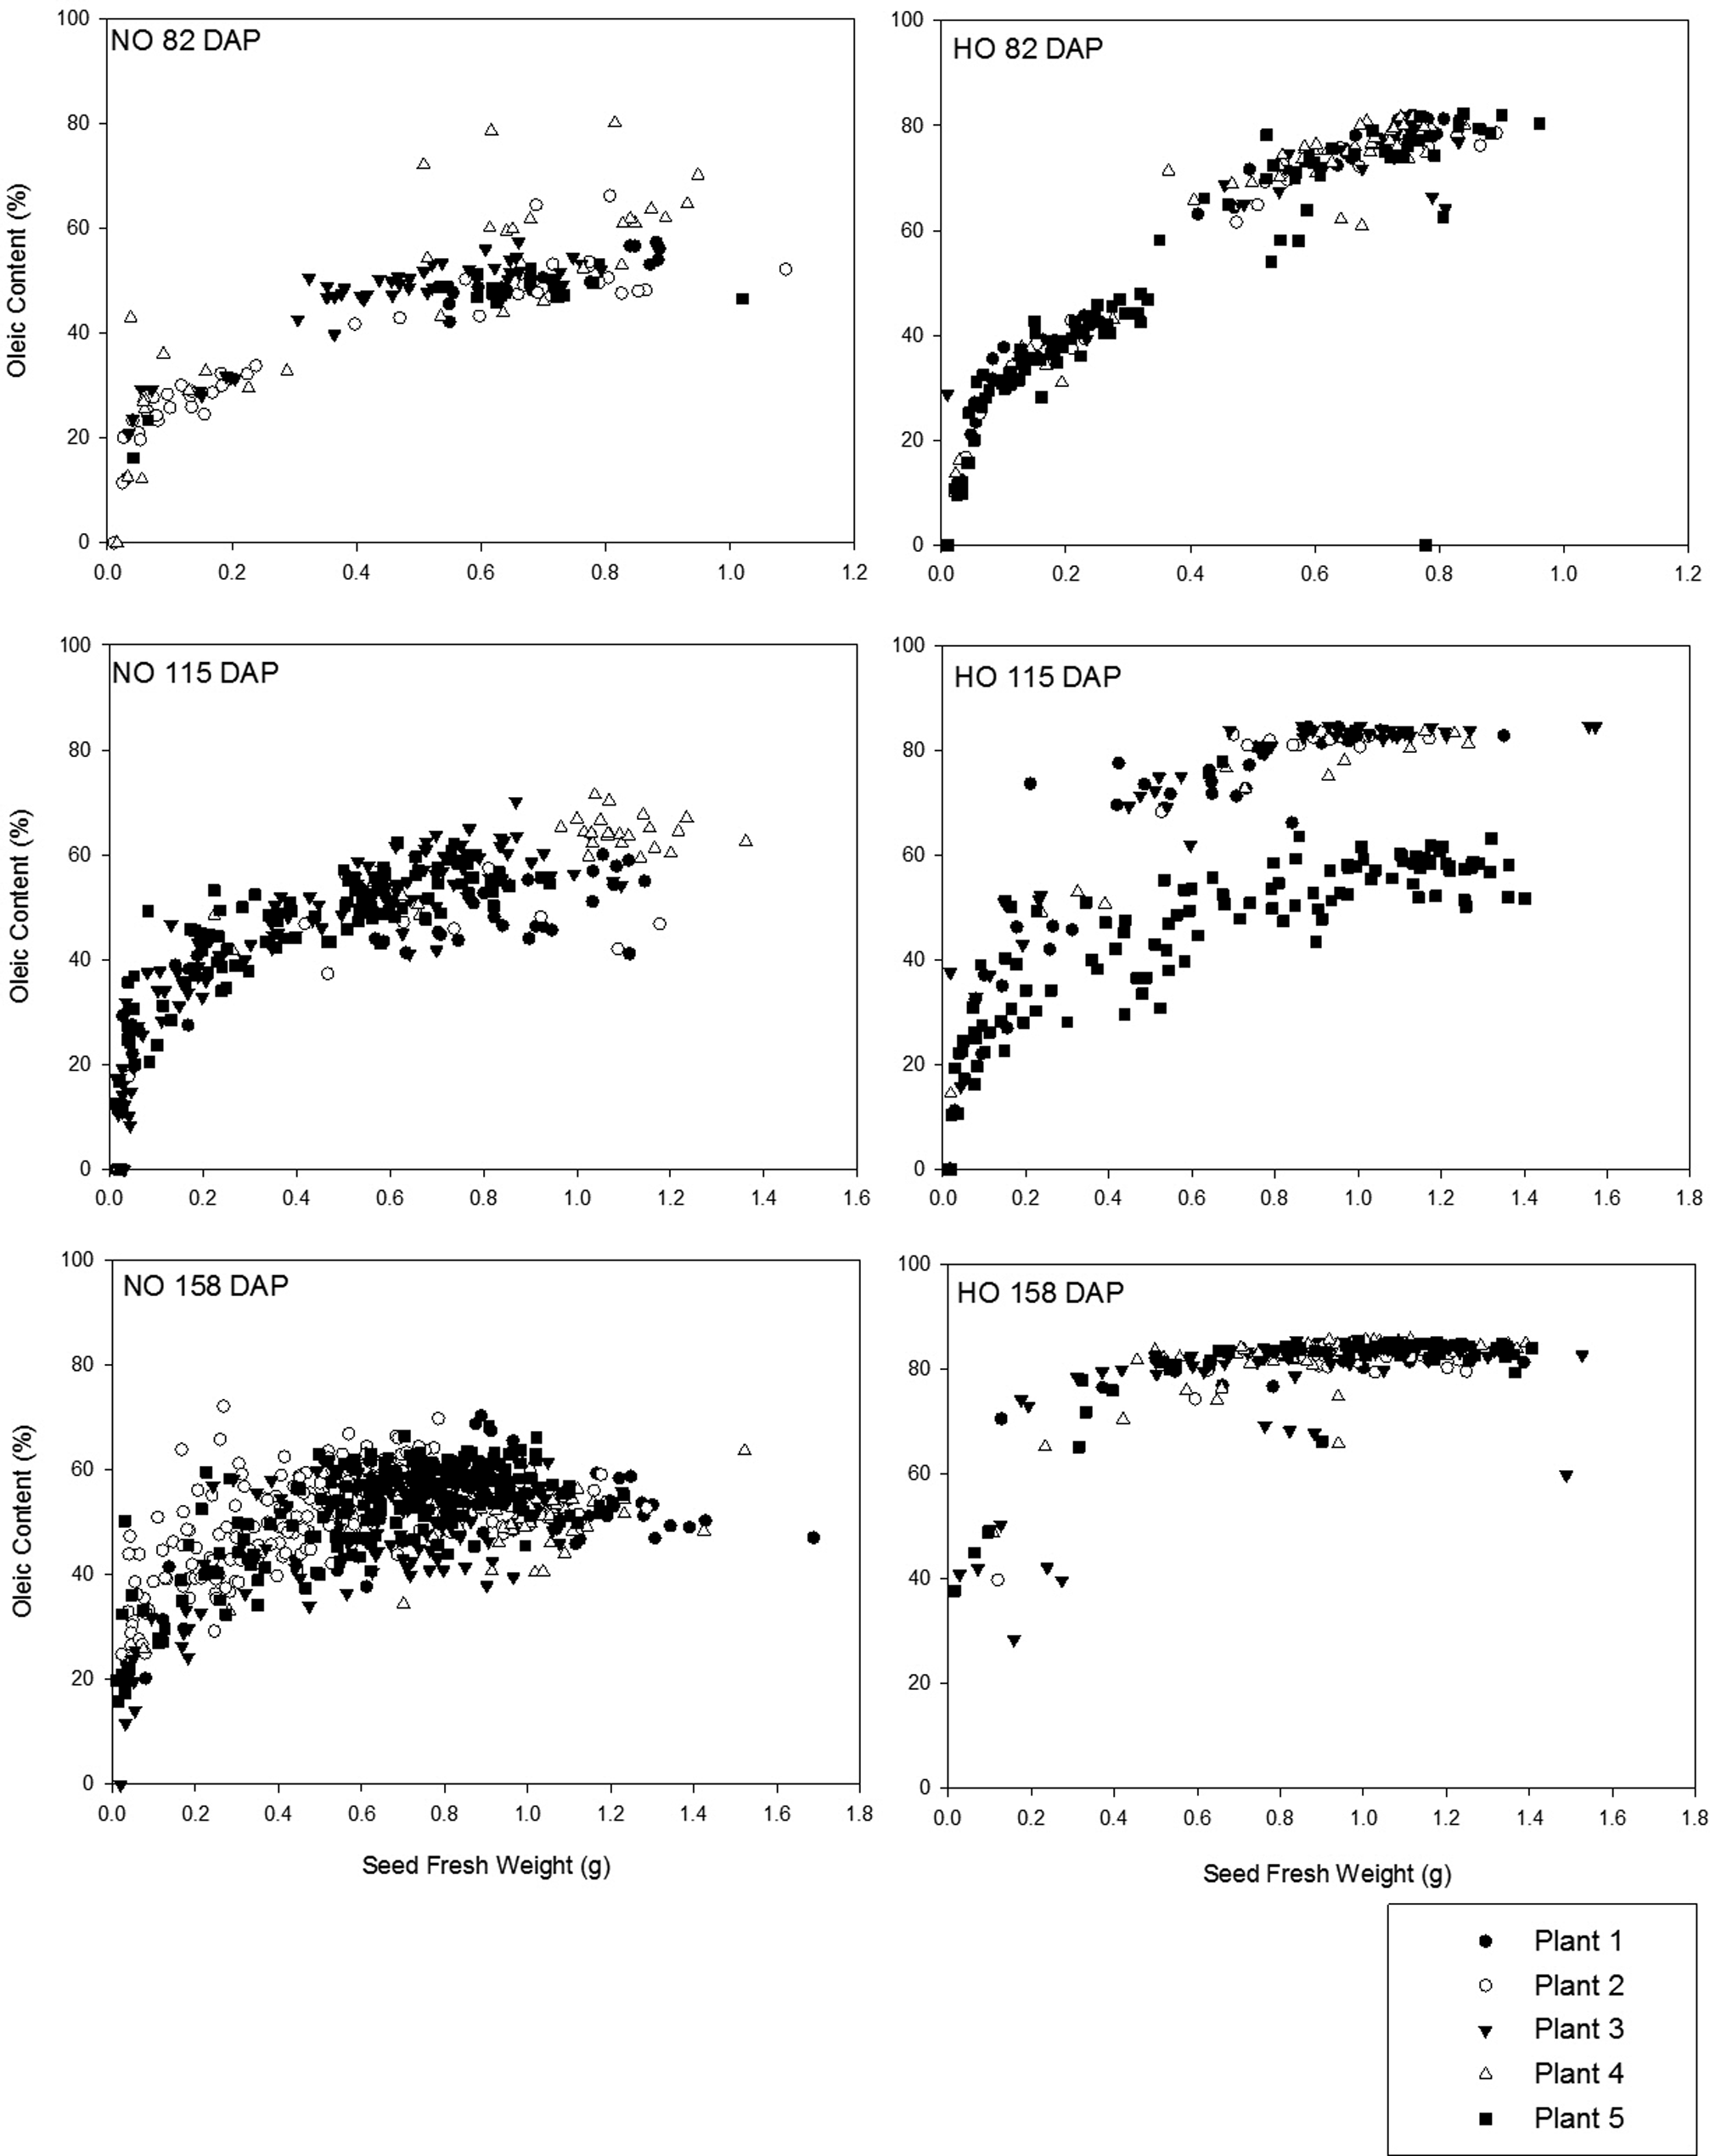
Development of oleic acid (%) with increasing seed weight (g) in Tifguard (NO = normal oleic) and C68-17 (HO = high oleic) runner-type cultivars over early (82 DAP = days after planting), middle (115 DAP), and late (158 DAP) sampling dates.
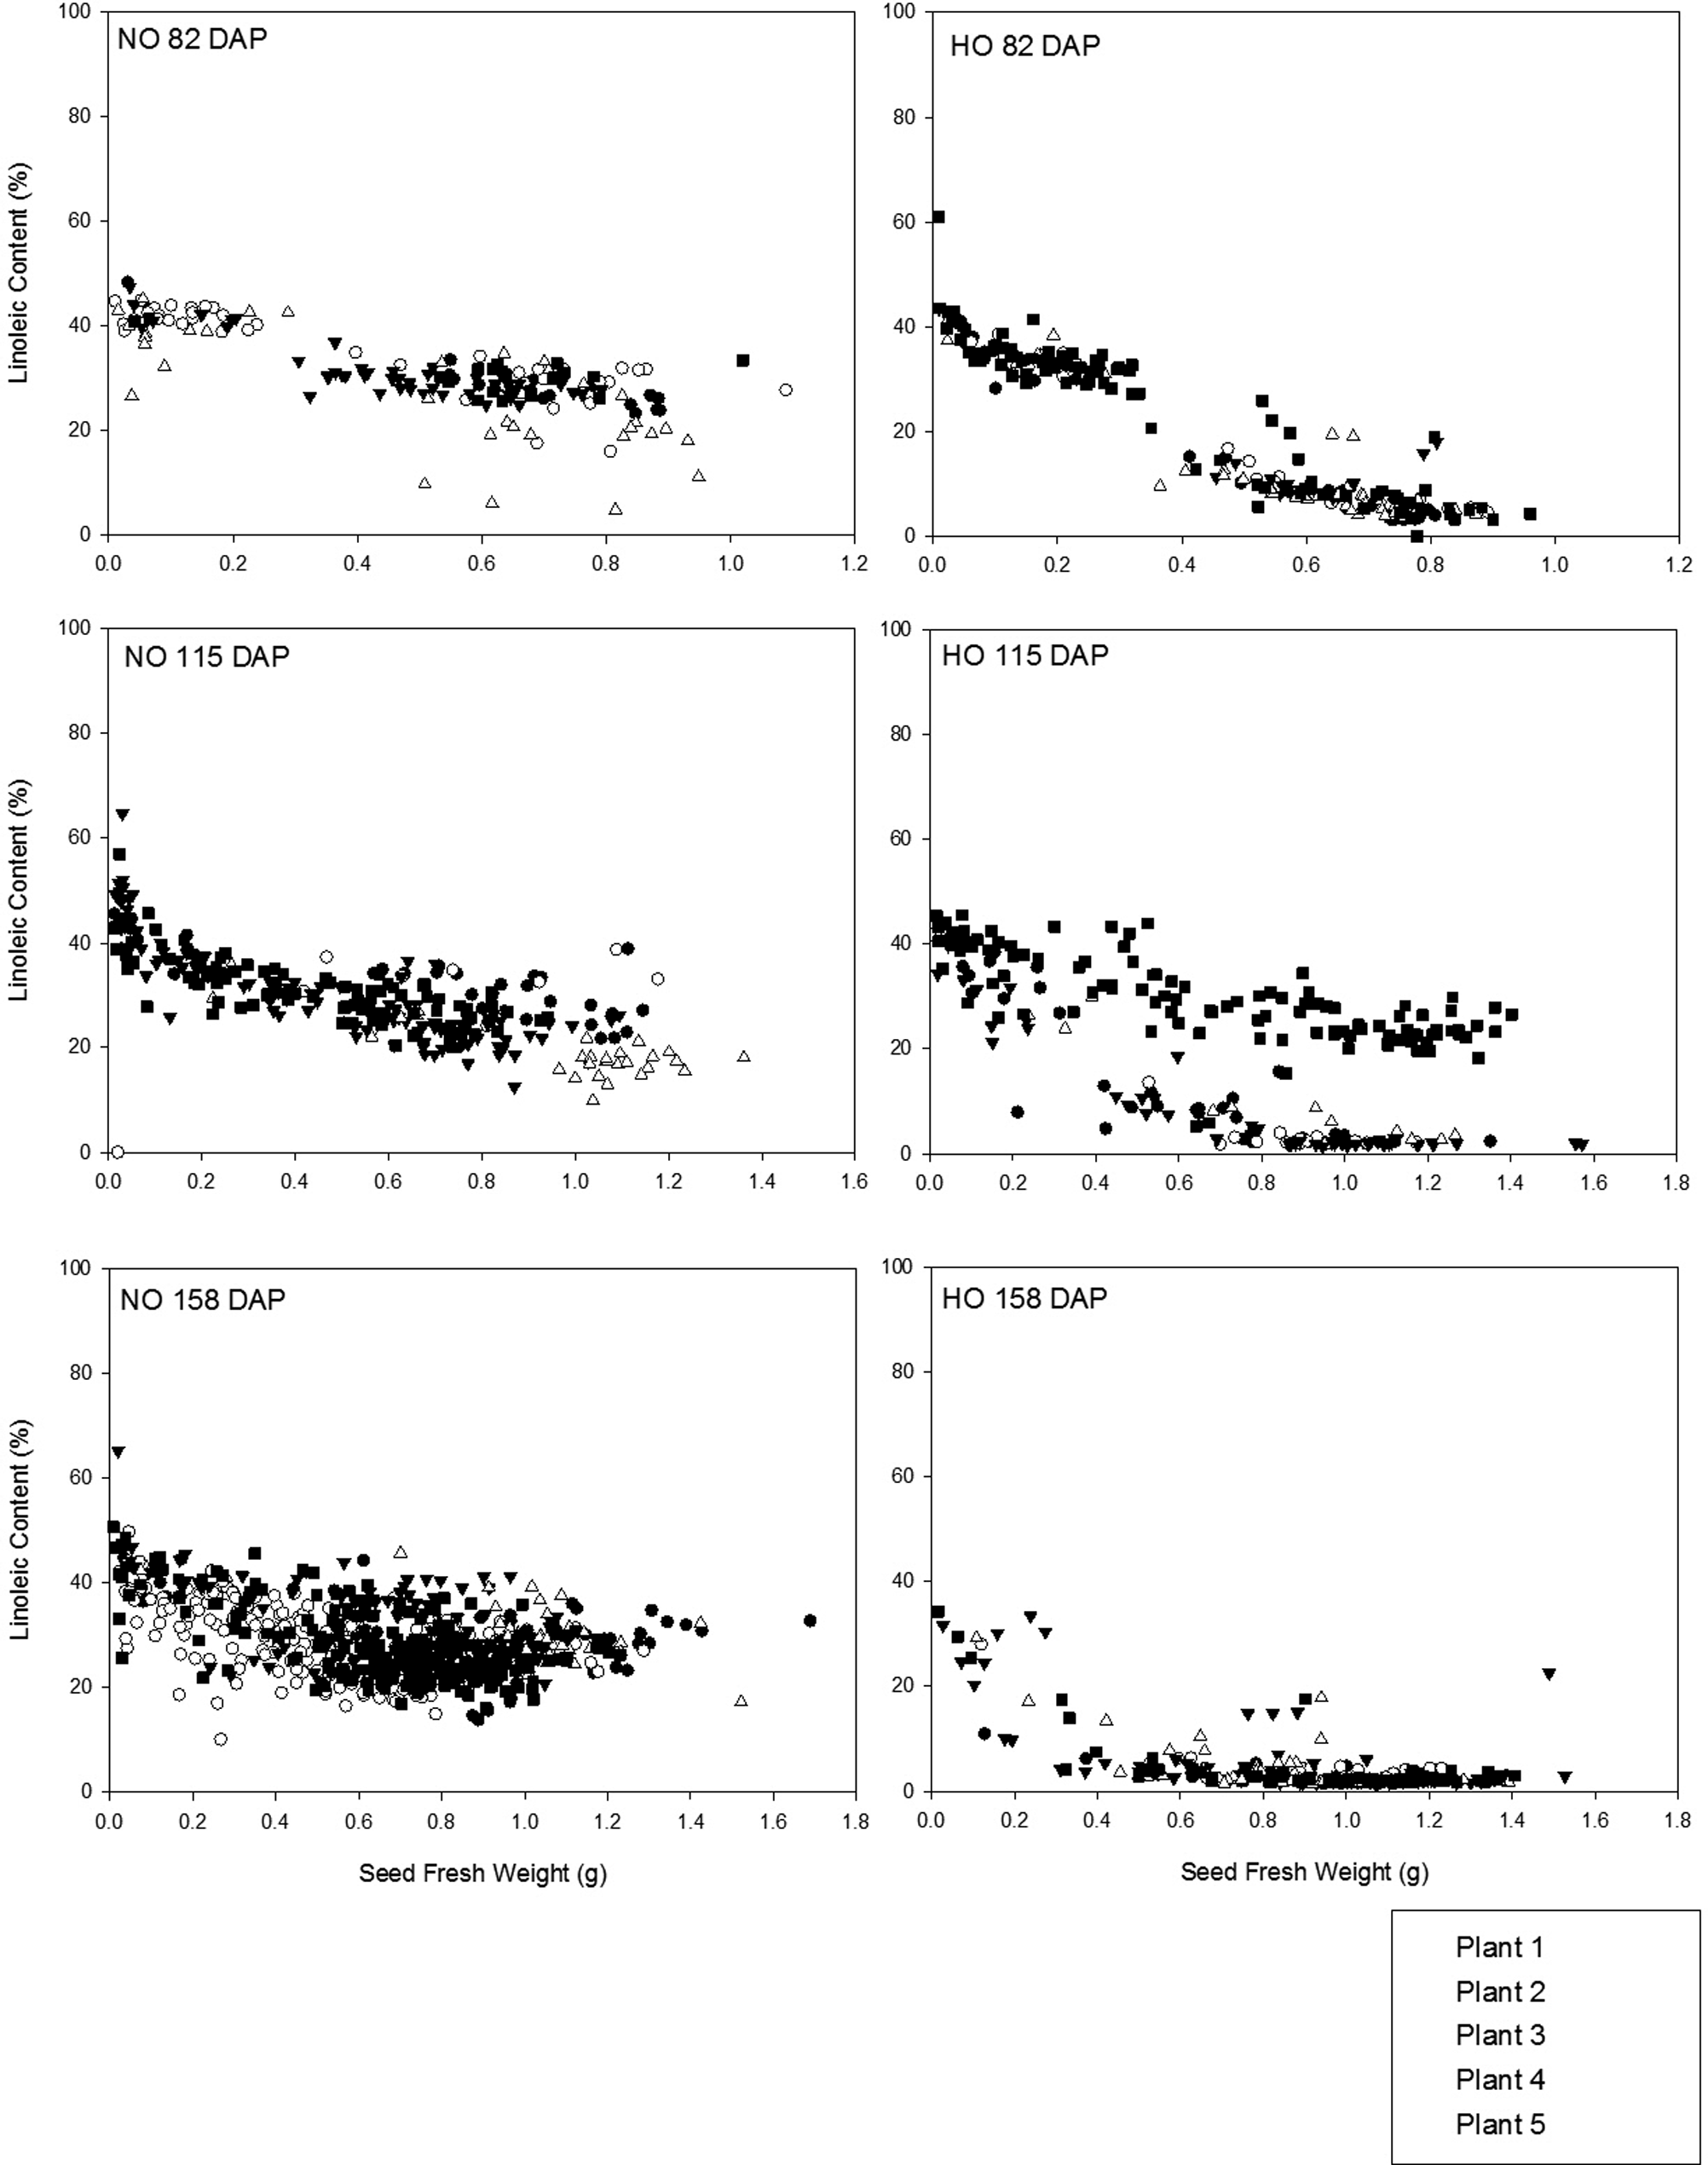
Development of linoleic acid (%) with increasing seed weight (g) Tifguard (NO = normal oleic) and C68-17 (HO = high oleic) runner-type cultivars over early (82 DAP = days after planting), middle (115 DAP), and late (158 DAP) sampling dates.
For Tifguard seed, the mean initial O/L ratio was 1.74 (± 1.72) at 82 DAP and were little changed by the final sampling at 158 DAP when it increased to 1.93 (± 0.77) (Figure 6). A broader range of O/L ratio values was observed among the C68-17 seed. Beginning 82 DAP, the mean O/L ratio was 6.96 (± 6.85) with seeds above the HO threshold of 9.0 observed only in seed with fresh weights greater than 0.5 g. At 115 DAP, the mean O/L ratio was 12.7 (± 16.8) with distinct groupings below and above the HO threshold of 9.0. Further investigation of this data demonstrated that the seeds responsible for the low O/L ratios observed at this date were from the same plant. It is likely that this one plant was grown from a seed which was not true-breeding for the HO trait. If the parent plants were homozygous recessive for the HO trait, when the plant self-pollinated, only HO progeny would have been expected. If the parent is still segregating, meaning that it is not homozygous recessive for the trait of interest or true-breeding, it is possible to obtain progeny which have different O/L ratio classifications (i.e. some HO and some NO) (Barkley et al., 2013). By the final sampling, 158 DAP, the average O/L ratio for the C68-17 cultivar was 34.0 (± 14.7) with a majority of seeds below the HO threshold of 9.0 being of fresh weights below 0.5 g. The range of O/L ratios present for all seed from all plants at the final sampling demonstrated that a range of O/L ratios exists among seeds from the same plant (Figure 6).
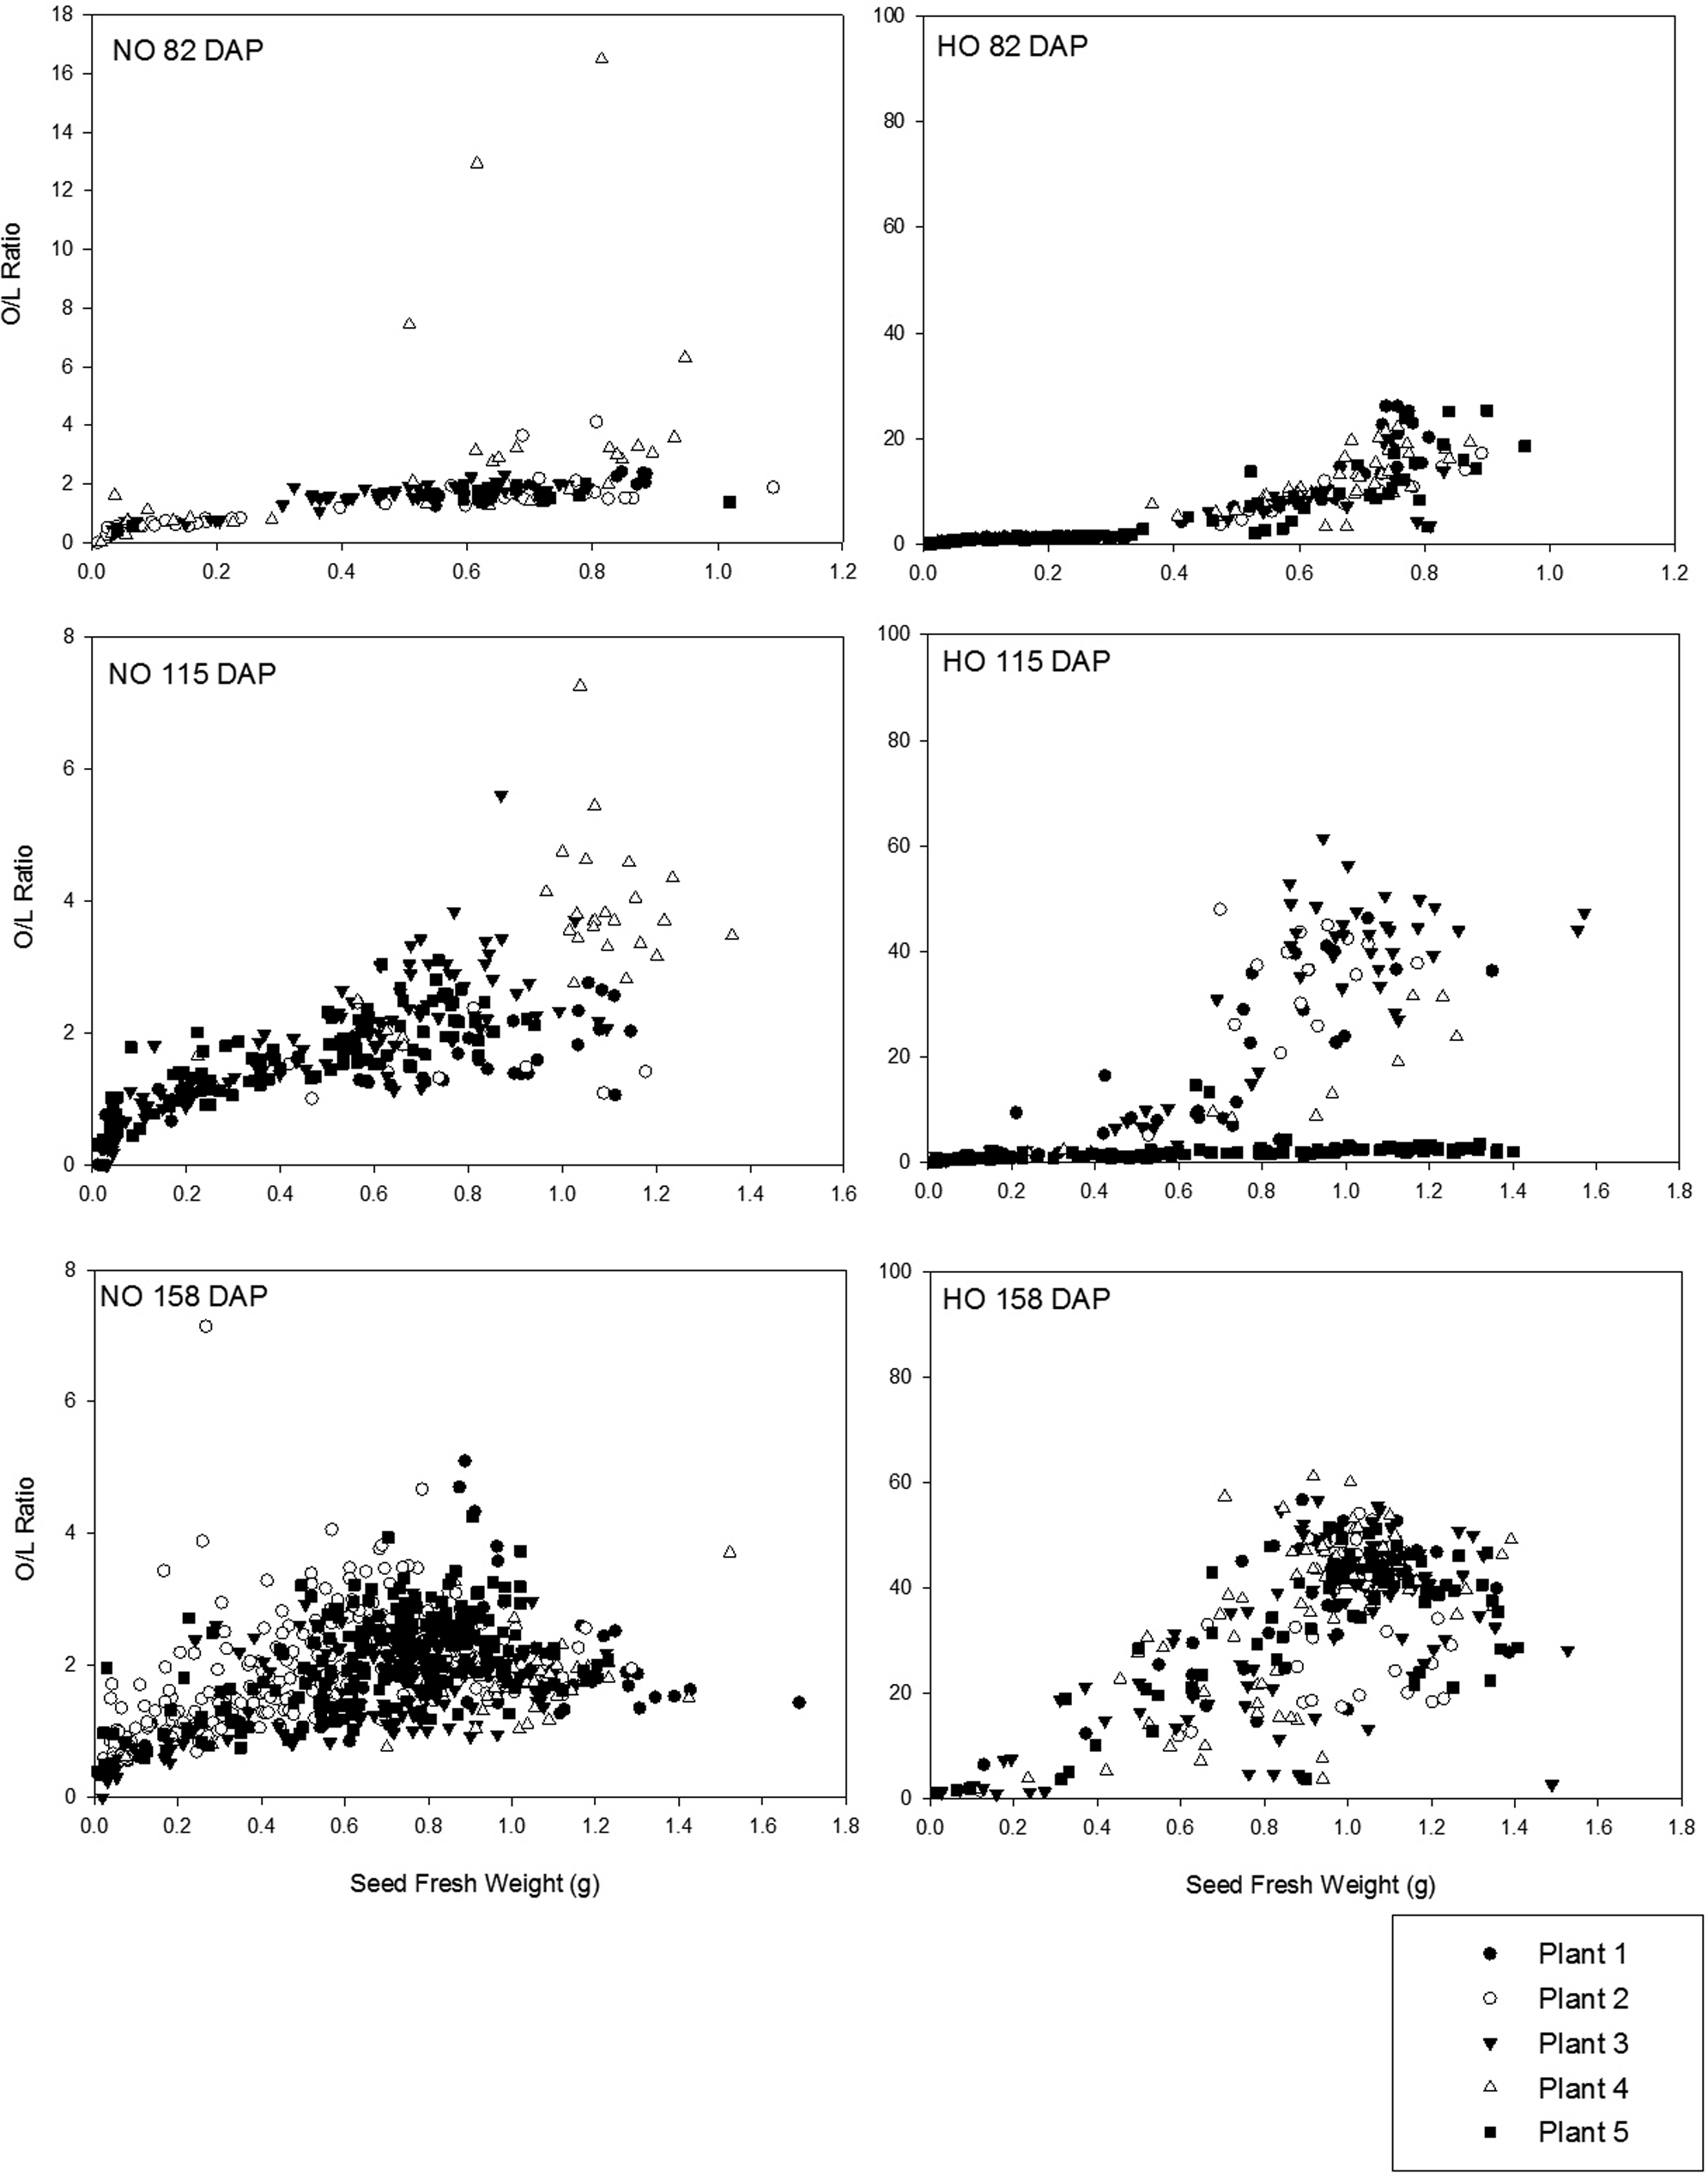
O/L (oleic to linoleic) ratio development in Tifguard (NO = normal oleic) and C68-17 (HO) runner-type cultivars over early (82 DAP = days after planting), middle (115 DAP), and late (158 DAP) sampling dates. Scales have been optimized for the NO data.
Conclusions
Unlike what was observed for the virginia-type seed, changes in seed fresh weight were more distinct between the HO and NO seed in the runner-type cultivars in that fewer seeds above 0.5 g for HO plants did not meet the HO threshold. From these findings, it is possible that the presence of some NO seeds found in what are expected to be purely HO lots could be explained as the result of normal peanut development. The authors are currently preparing an additional publication to specifically address the effect of maturity as measured by the hull scrape method on O/L ratio. Finding developmental factors which can closely predict O/L ratio development would be useful in minimizing the incidence of perceived contamination of HO peanut lots with NO seed resulting from differences in physiological development.
Acknowledgements
The authors would like to thank Dr. Clyde R. Bogle superintendent of the Upper Coastal Plain Research Station of North Carolina State University for assistance with the production of the virginia-type peanut samples and Dr. Corley C. Holbrook of the USDA-ARS Crop Genetics and Breeding Research Unit in Tifton, Georgia for providing the runner-type peanut samples and for his guidance in describing the runner cultivars.
Literature Cited
American Oil Chemists Society 2005 Official Method Ce 1h-05. Determination of cis- and trans-, saturated, monounsaturated and polyunsaturated fatty acids in vegetable or non-ruminant animal oils and fats by capillary GLC . In Firestone D. (ed.) Official Methods and Recommended Practices of the AOCS 5th ed AOCS , Champaign, IL .
Andersen P.C. Hill K. Gorbet D.W. and Brodbeck B.V. 1998 Fatty acid and amino acid profiles of selected peanut cultivars and breeding lines J. Food Comp. Anal. 11 : 100 – 111 .
Barkley N.A. Isleib T.G. Wang M.L. and Pittman R.N. 2013 Genotypic effect of ahFAD2 on fatty acid profiles in six segregating peanut (Arachis hypogaea L.) populations BMC Genet. 14 : 62 .
Braddock J.C. Sims C.A. and O’Keefe S.F. 1995 Flavor and oxidative stability of roasted high-oleic acid peanuts J. Food Sci. 60 : 489 – 493 .
Butts C.L. and Smith J.S. 1995 Shrinkage of farmers stock peanuts during storage Peanut Sci. 22 : 33 – 41 .
Chu Y. Wu C.L. Holbrook C.C. Tillman B.L. Person G. and Ozias-Akins P. 2011 Marker-assisted selection to pyramid nematode resistance and the high oleic trait in peanut The Plant Genome 4 : 110 – 117 .
Dean L.L. Hendrix K.W. Holbrook C.C. and Sanders T.H. 2009 Content of some nutrients in the core of the core of the peanut germplasm collection Peanut Sci. 36 : 104 – 120 .
Gorbet D.W. and Tillman B.L. 2009 Registration of ‘Florida-07’ peanut J. Plant Reg. 3 : 14 – 18 .
Hammond E.G. Duvick D. Wang T. Dodo H. and Pittman R.N. 1997 Survey of the fatty acid composition of peanut (Arachis hypogaea) germplasm and characterization of their epoxy and eicosenoic acids J. Amer. Oil Chem. Soc. 74 : 1235 – 1239 .
Holbrook C.C. Timper P. Culbreath A.K. and Kvien C. 2008 Registration of ‘Tifguard’ peanut J. Plant Reg. 2 : 92 – 94 .
Isleib T.G. Milla-Lewis S.R. Pattee H.E. Copeland S.C. Zuleta M.C. Shew B.B. Hollowell J.E. Sanders T.H. Dean L.O. Hendrix K.W. Balota M. and Chapin J.W. 2009 Registration of ‘Bailey’ peanut J. Plant Reg. 5 : 27 – 39 .
Jung S. Powell G. Moore K. and Abbott A. 2000 The high oleate trait in the cultivated peanut (Arachis hypogaea L.) II Molecular basis and genetics of the trait. Mol. Genet. Genomics 263 : 806 – 811 .
Ketring L D. Brown R.H. Sullivan G.A. and Johnson B.B. 1982 Growth physiology, pp. 411–457 . In: Pattee H.E. and Young C.T. ( eds. ) Peanut Science and Technology American Peanut Research and Education Society, Inc. , Yoakum, Texas .
McNeill K.M. and Sanders T.H. 1996 Pod and seed size relation to maturity and in-shell quality potential in virginia-type peanuts Peanut Sci. 23 : 133 – 137 .
Norden A.J. Gorbet D.W. Knauft D.A. and Young C.T. 1987 Variability in oil quality among peanut genotypes in the Florida breeding program Peanut Sci. 14 : 7 – 11 .
O’Keefe S.F. Wiley V.A. and Knauft D.A. 1993 Comparison of oxidative stability of high- and normal-oleic peanut oils J. Amer. Oil Chem. Soc. 70 : 489 – 492 .
Pattee H.E. Wynne J.C. Young J.H. and Cox F.R. 1977 The seed-hull weight ratio as an index of peanut maturity Peanut Sci. 4 : 47 – 50 .
Sanders T.H. 1980 Fatty acid composition of lipid classes in oils from peanuts differing in variety and maturity J. Amer. Oil Chem. Soc. 57 : 8 – 11 .
Sanders T.H. 1989 Maturity distribution in commercially sized Florunner peanuts Peanut Sci. 16 : 91 – 95 .
Sanders H T. Lansden J.A. Greene R.L. Drexler J.S. and Williams E.J. 1982 Oil characteristics of peanut fruit separated by a nondestructive maturity class method Peanut Sci. 9 : 20 – 23.
Schenk R.U. 1961 Development of the peanut fruit Georgia Agric. Exp. Sta. Tech. Bull. N.S. 22 .
Tillman B.L. and Gorbet D.W. 2012 Registration of the ‘Spain’ peanut USDA Plant Variety Protection Certificate 201200394 .
Williams J.R. Duncan S.E. Williams R.C. Mallikarjunan K. Eigel W. N and O’Keefe S.F. 2006 Flavor fade in peanuts during short-term storage J. Food Sci. 71 : S265 – 269 .
Zeile L W. Knauft D.A. and Kelly C.B. 1993 A rapid non-destructive technique for fatty acid determination in individual peanut seed Peanut Sci. 20 : 9 – 11 .
Notes
- First Author, Graduate Student, Department of Food, Bioprocessing, and Nutrition Sciences, North Carolina State University, Raleigh, NC 27695; Second, third and fourth authors: Food Technologist, Research Leader, Research Food Technologist, respectively, USDA-ARS Market Quality and Handling Research Unit, Raleigh, NC 27695 *Corresponding author’s E-mail: lisa.dean@ars.usda.gov
Author Affiliations