

Introduction
Since the mid-1990s, tomato spotted wilt (TSW) caused by Tomato spotted wilt tospovirus (TSWV) has become a serious constraint to peanut (Arachis hypogaea L.) production in the Virginia-Carolina (VC) production area (Shew, 2005). Field resistance to TSW is considered to be an important component of programs designed to manage the disease and is one of the primary objectives of the N.C. State University peanut breeding program. The program has monitored the reaction of cultivars and breeding lines to TSW in field plots planted for that purpose since 1996. In these studies, increased seed spacing (25–50 cm) within rows and withholding of in-furrow and other insecticide use was utilized to encourage feeding by thrips (Frankliniella fusca Hinds) which leads to increased disease development. Incidence of TSW was also recorded in trials planted for other purposes when symptoms of TSW were obvious.
Prior to its release in 2000, the cultivar Perry (Isleib et al., 2003) was tested for reaction to TSW in eight tests, and it was found to have incidence of TSW comparable to that of Gregory (Isleib et al., 1999) (9.2 vs. 6.5% of emerged plants showing TSW symptoms, NS). However, once Perry was grown commercially it was found to be highly susceptible to TSW. The growing seasons of 2000, 2001, and 2002 were notable for levels of TSW incidence that had not been encountered before or since in the VC production area. It is not known what the cause of this increase in disease severity was whether increased or more efficient transmission of the disease, shifts in thrips species leading to variation in transmission, or the occurrence of different more virulent strains of the virus. Because of the evidently erroneous conclusion made about Perry's reaction to TSW on the basis of data collected prior to 2000, it was clear that some methodology other than simple comparison of means across tests should be employed to identify advanced breeding lines that might exhibit high susceptibility to TSW under high general levels of disease.
Stability analysis has been used in many plant breeding programs to dissect genotype-by-environment (GxE) interaction for yield. There are several methodologies that can be used, including variance components (Cockerham, 1963; Comstock and Moll, 1963; Plaisted and Peterson, 1959; Shukla, 1972), regression (Finlay and Wilkinson, 1963; Eberhart and Russell, 1966), and descriptive multivariate approaches (Lin et al., 1986). Each methodology has variation in its details, each has adherents, and each has critics. The regression approach, partitioning variation due to genotype-by-environment interaction into parts due to response to an environmental index and others due to deviation of the line's value in a particular environment from that predicted by regression, is particularly applicable to disease data. In the case of yield, there are many reasons why an environmental index, usually calculated as the average performance of the lines tested in a particular environment, could be low. Any of numerous yield constraints, e.g., low or toxic levels of plant nutrients, any of the diseases that affect the crop, excessively low or high temperatures during the growing season, poor weed management, too early or too late planting, etc., can reduce the average yield at a given location in a given year. However, in the case of a specific disease, the average disease incidence or severity at a location should provide a reasonably good index for the environment. This sort of approach was used by Wells et al. (2002) to examine the reactions of runner-type cultivars C-99R (Gorbet and Shokes, 2002), Georgia Green (Branch, 1996), and Georgia Runner (Branch, 1991) across 13 tests with varying degrees of overall TSW severity. Stability analysis also was used to evaluate host genotype-by-isolate interactions, wherein isolates of Cercosporidium personatum constituted the “environment” (Shew et al., 1996). Presumably, interactions indicate specificity of an isolate or isolates on resistant hosts and therefore lack of durability of resistance (Jenns et al., 1982). While not addressed herein, it is possible stability analysis could be used to track changes in virus populations. Over time, increasing deviations from regression could indicate emergence of races, whereas increasing slope could indicate selection for aggressive isolates. However, it is not clear how one would separate environment in the aggregate from the virus “environment.”
The objective of this study was to apply a regression stability analysis to TSW incidence data collected over several years to determine if an array of virginia-type cultivars exhibited variation in their reactions to increasing levels of general TSW intensity.
Materials and Methods
Although data were available for a large number of experimental breeding lines, data were retained for use in this analysis for only 31 genotypes tested in at least 8 of the 17 years from 1996 through 2012. These included 11 virginia-type cultivars released by N.C. State Univ.: NC 7 (Wynne et al., 1979), NC 9 (Wynne et al., 1986), NC 10C (Wynne et al., 1991a), NC-V 11 (Wynne et al., 1991b), NC 12C (Isleib et al., 1997), Gregory, Perry, Brantley (Isleib et al., 2006a), Phillips (Isleib et al., 2006b), Bailey (Isleib et al., 2011), and Sugg. Thirteen experimental lines and one unregistered cultivar were included (Table 1) as were three cultivars released by Virginia Polytechnic Inst. and State Univ.: VA-C 92R (Mozingo et al., 1994), VA 98R (Mozingo et al., 2000), and Wilson (Mozingo et al., 2004). Four disease-resistant checks were included: the TSW-field-resistant runner-type cultivar Georgia Green, leaf spot-resistant germplasm line GP-NC 343 (Campbell et al., 1971), multiply disease-resistant germplasm line N960976L (Isleib et al., 2006c) and TSW-field-resistant hirsuta-type (A. hypogaea subsp. hypogaea var. hirsuta Köhler) PI 576636, collected in the state of Guanajuato, Mexico.
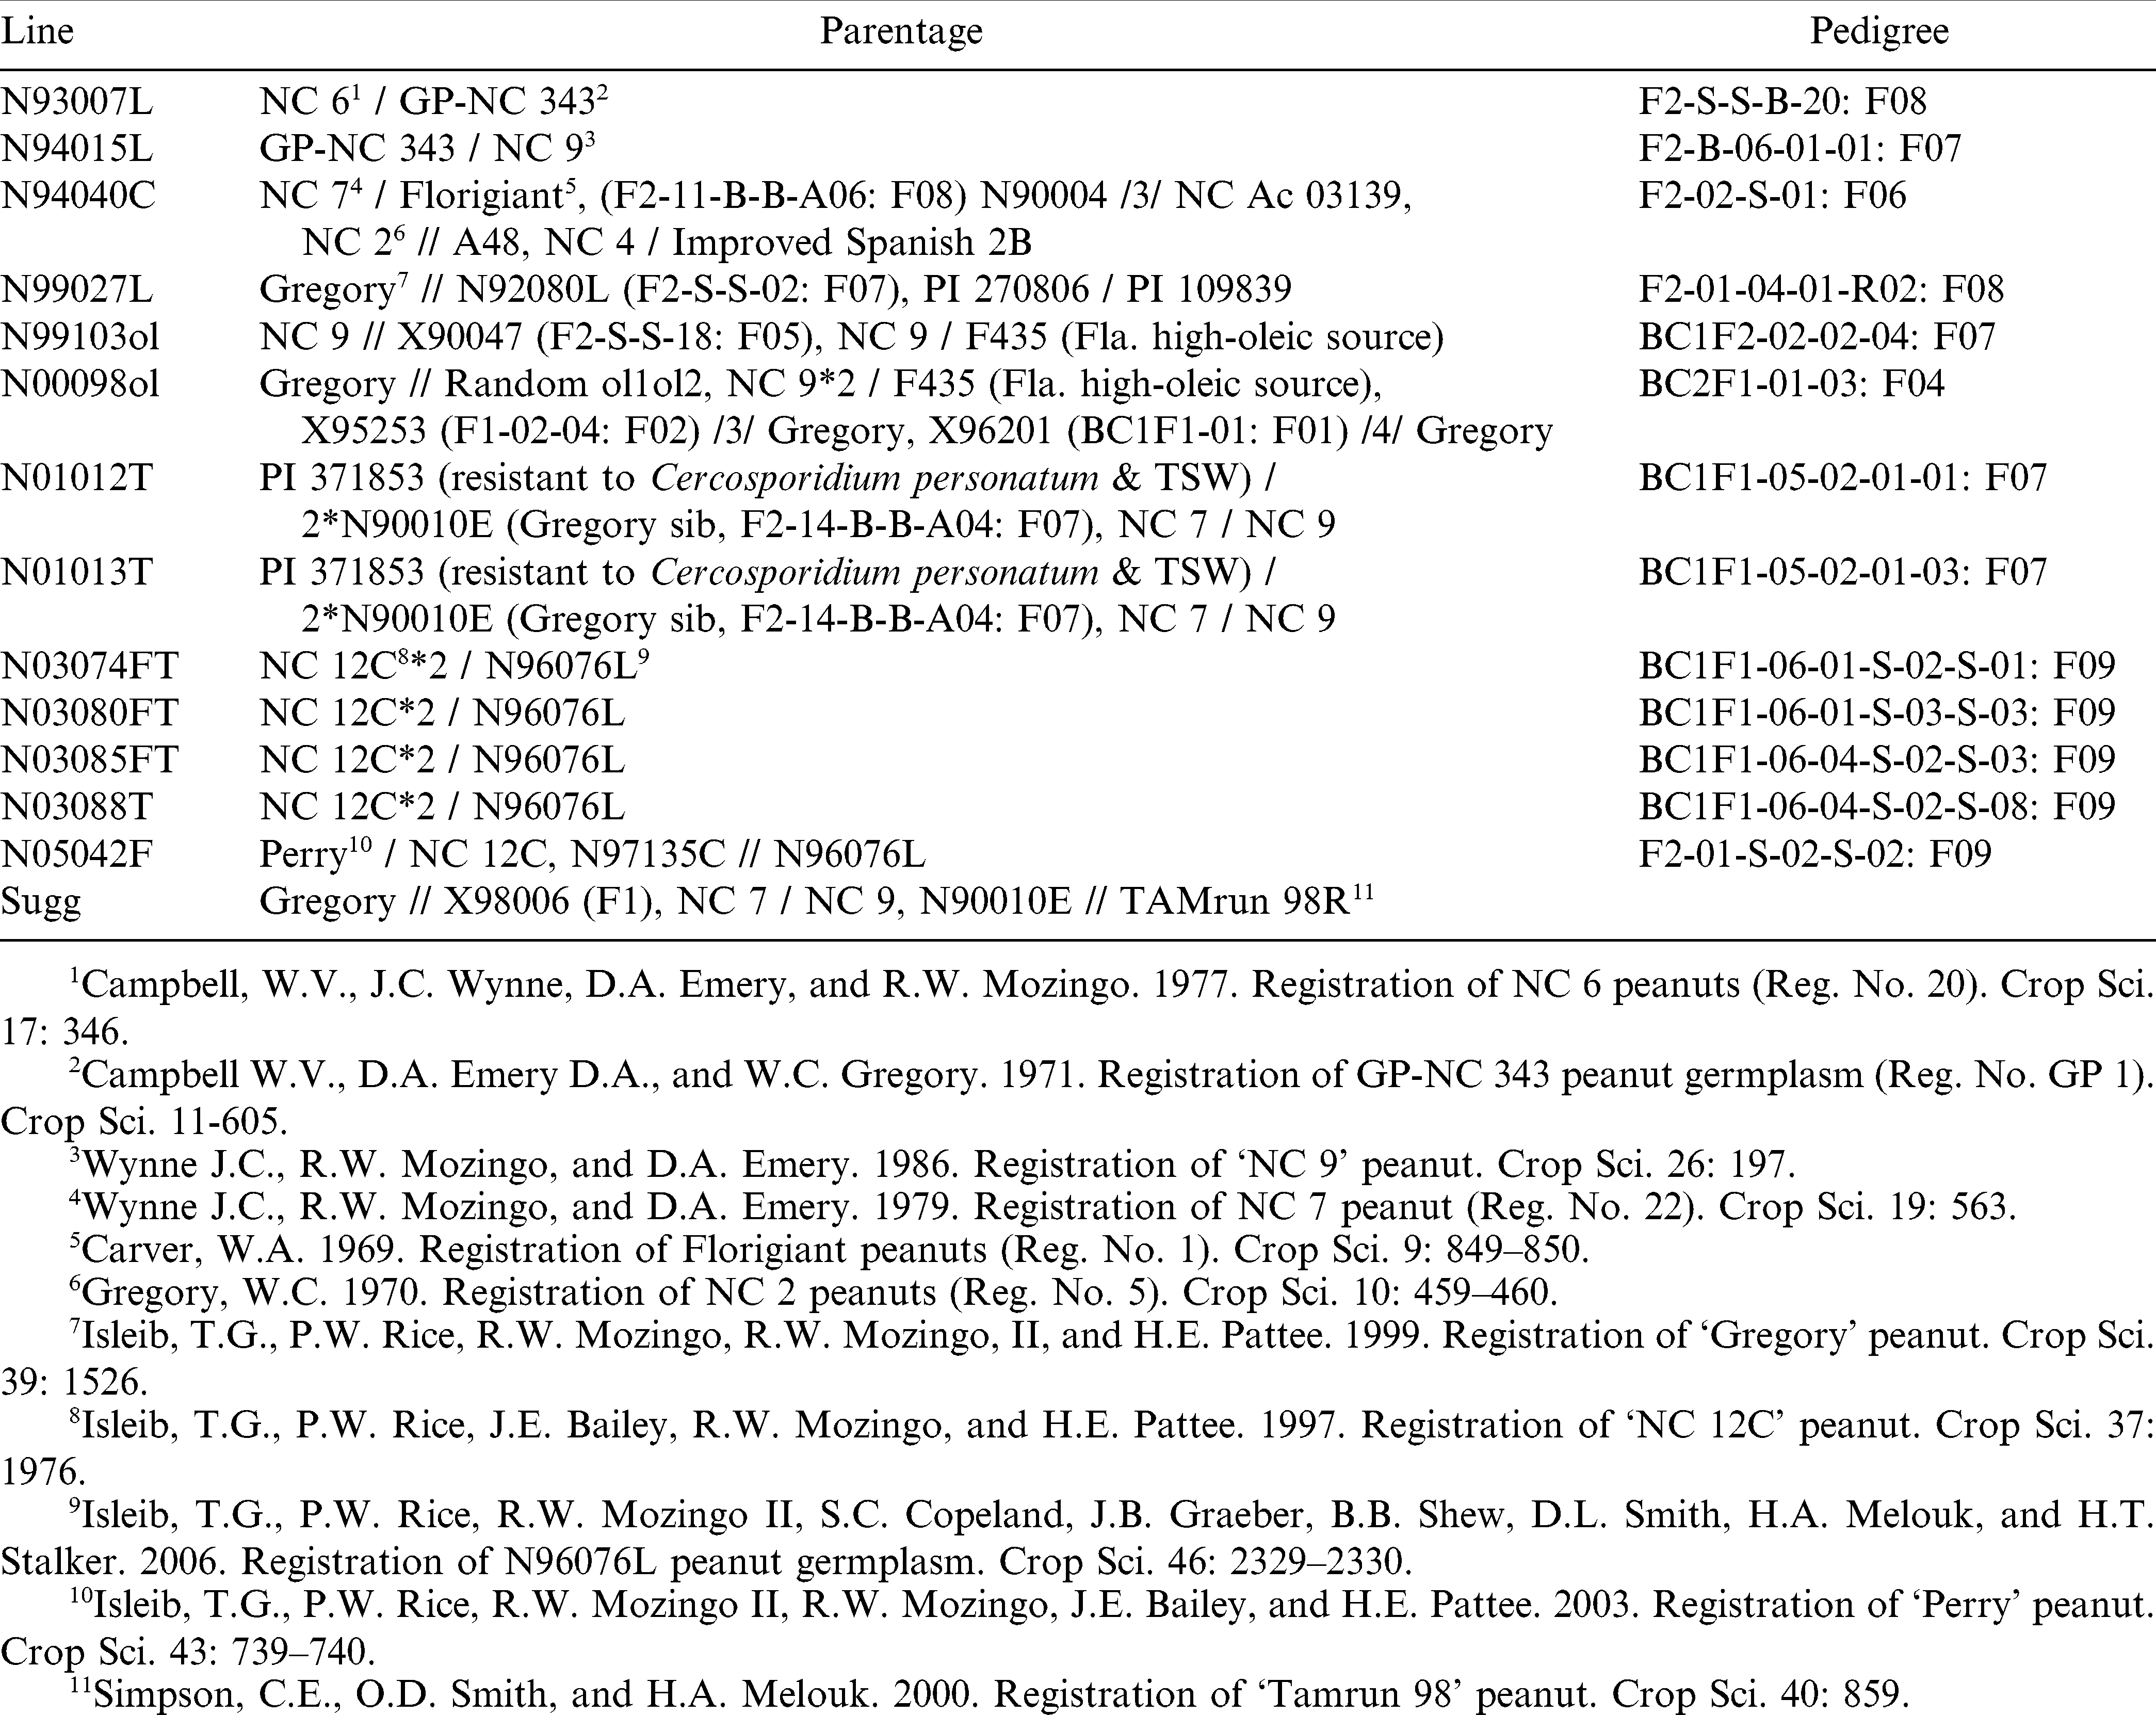
Origins of N.C. State Univ. breeding lines and the unregistered cultivar tested for field resistance to tomato spotted wilt.
The data for this study were collected in 64 experiments conducted from 1996 to 2012 (Table 2). Most of the tests were conducted specifically for the evaluation of TSW symptoms at the N.C. Dept. of Agriculture and Consumer Services' Peanut Belt Res. Stn. at Lewiston (Bertie Co.), NC, but others were conducted on farmers' fields in Gates, Martin, Northampton, and Perquimans Cos. on North Carolina's northeastern coastal plain. Because the tests comprised large numbers of entries, each was conducted in an incomplete block design, either a square or rectangular lattice commensurate with the number of entries and with two, three or four replicates. Each TSW test was conducted using wide seed spacing (25 or 50 cm) and no in-furrow insecticide. These conditions promoted survival and feeding by tobacco thrips [Frankliniella fusca (Hinds)], the predominant insect vector of TSWV in North Carolina. Other trials were planted for purposes other than TSW evaluation, but sufficient TSW developed to allow scoring of symptomatic plants. In TSW trials, plant stands were counted approximately four weeks after planting, and plants expressing symptoms of TSW were counted three to six times during the growing season, starting in July. In trials planted for purposes other than TSW evaluation, one or two counts were made in late September or early October. Symptoms included early to mid-season stunting and flecking or ring-spots on leaves, petiole curling, brown flecking on leaflet undersides, and late-season wilting and death of the plants. Above-ground symptoms of Cylindrocladium black rot (CBR) caused by C. parasiticum Crous, Wingfield & Alfenas are similar to those of late-season TSW, but they are usually accompanied by root or pod rot. Plants dying from CBR typically can be pulled up easily due to extensive root rot. The main stem of each plant in question was tugged to determine if the root system was healthy. If the plant did not uproot, then it was counted as having symptoms of TSW. The maximum number of dead or diseased plants in a plot was expressed as a proportion of the early-season plant stand and subjected to analysis of variance. Means, adjusted to a common block effect in cases where the effect of blocks within reps was found to be significant (P<0.05), were compiled in a database. The adjusted mean proportions were used for stability analysis in this study.
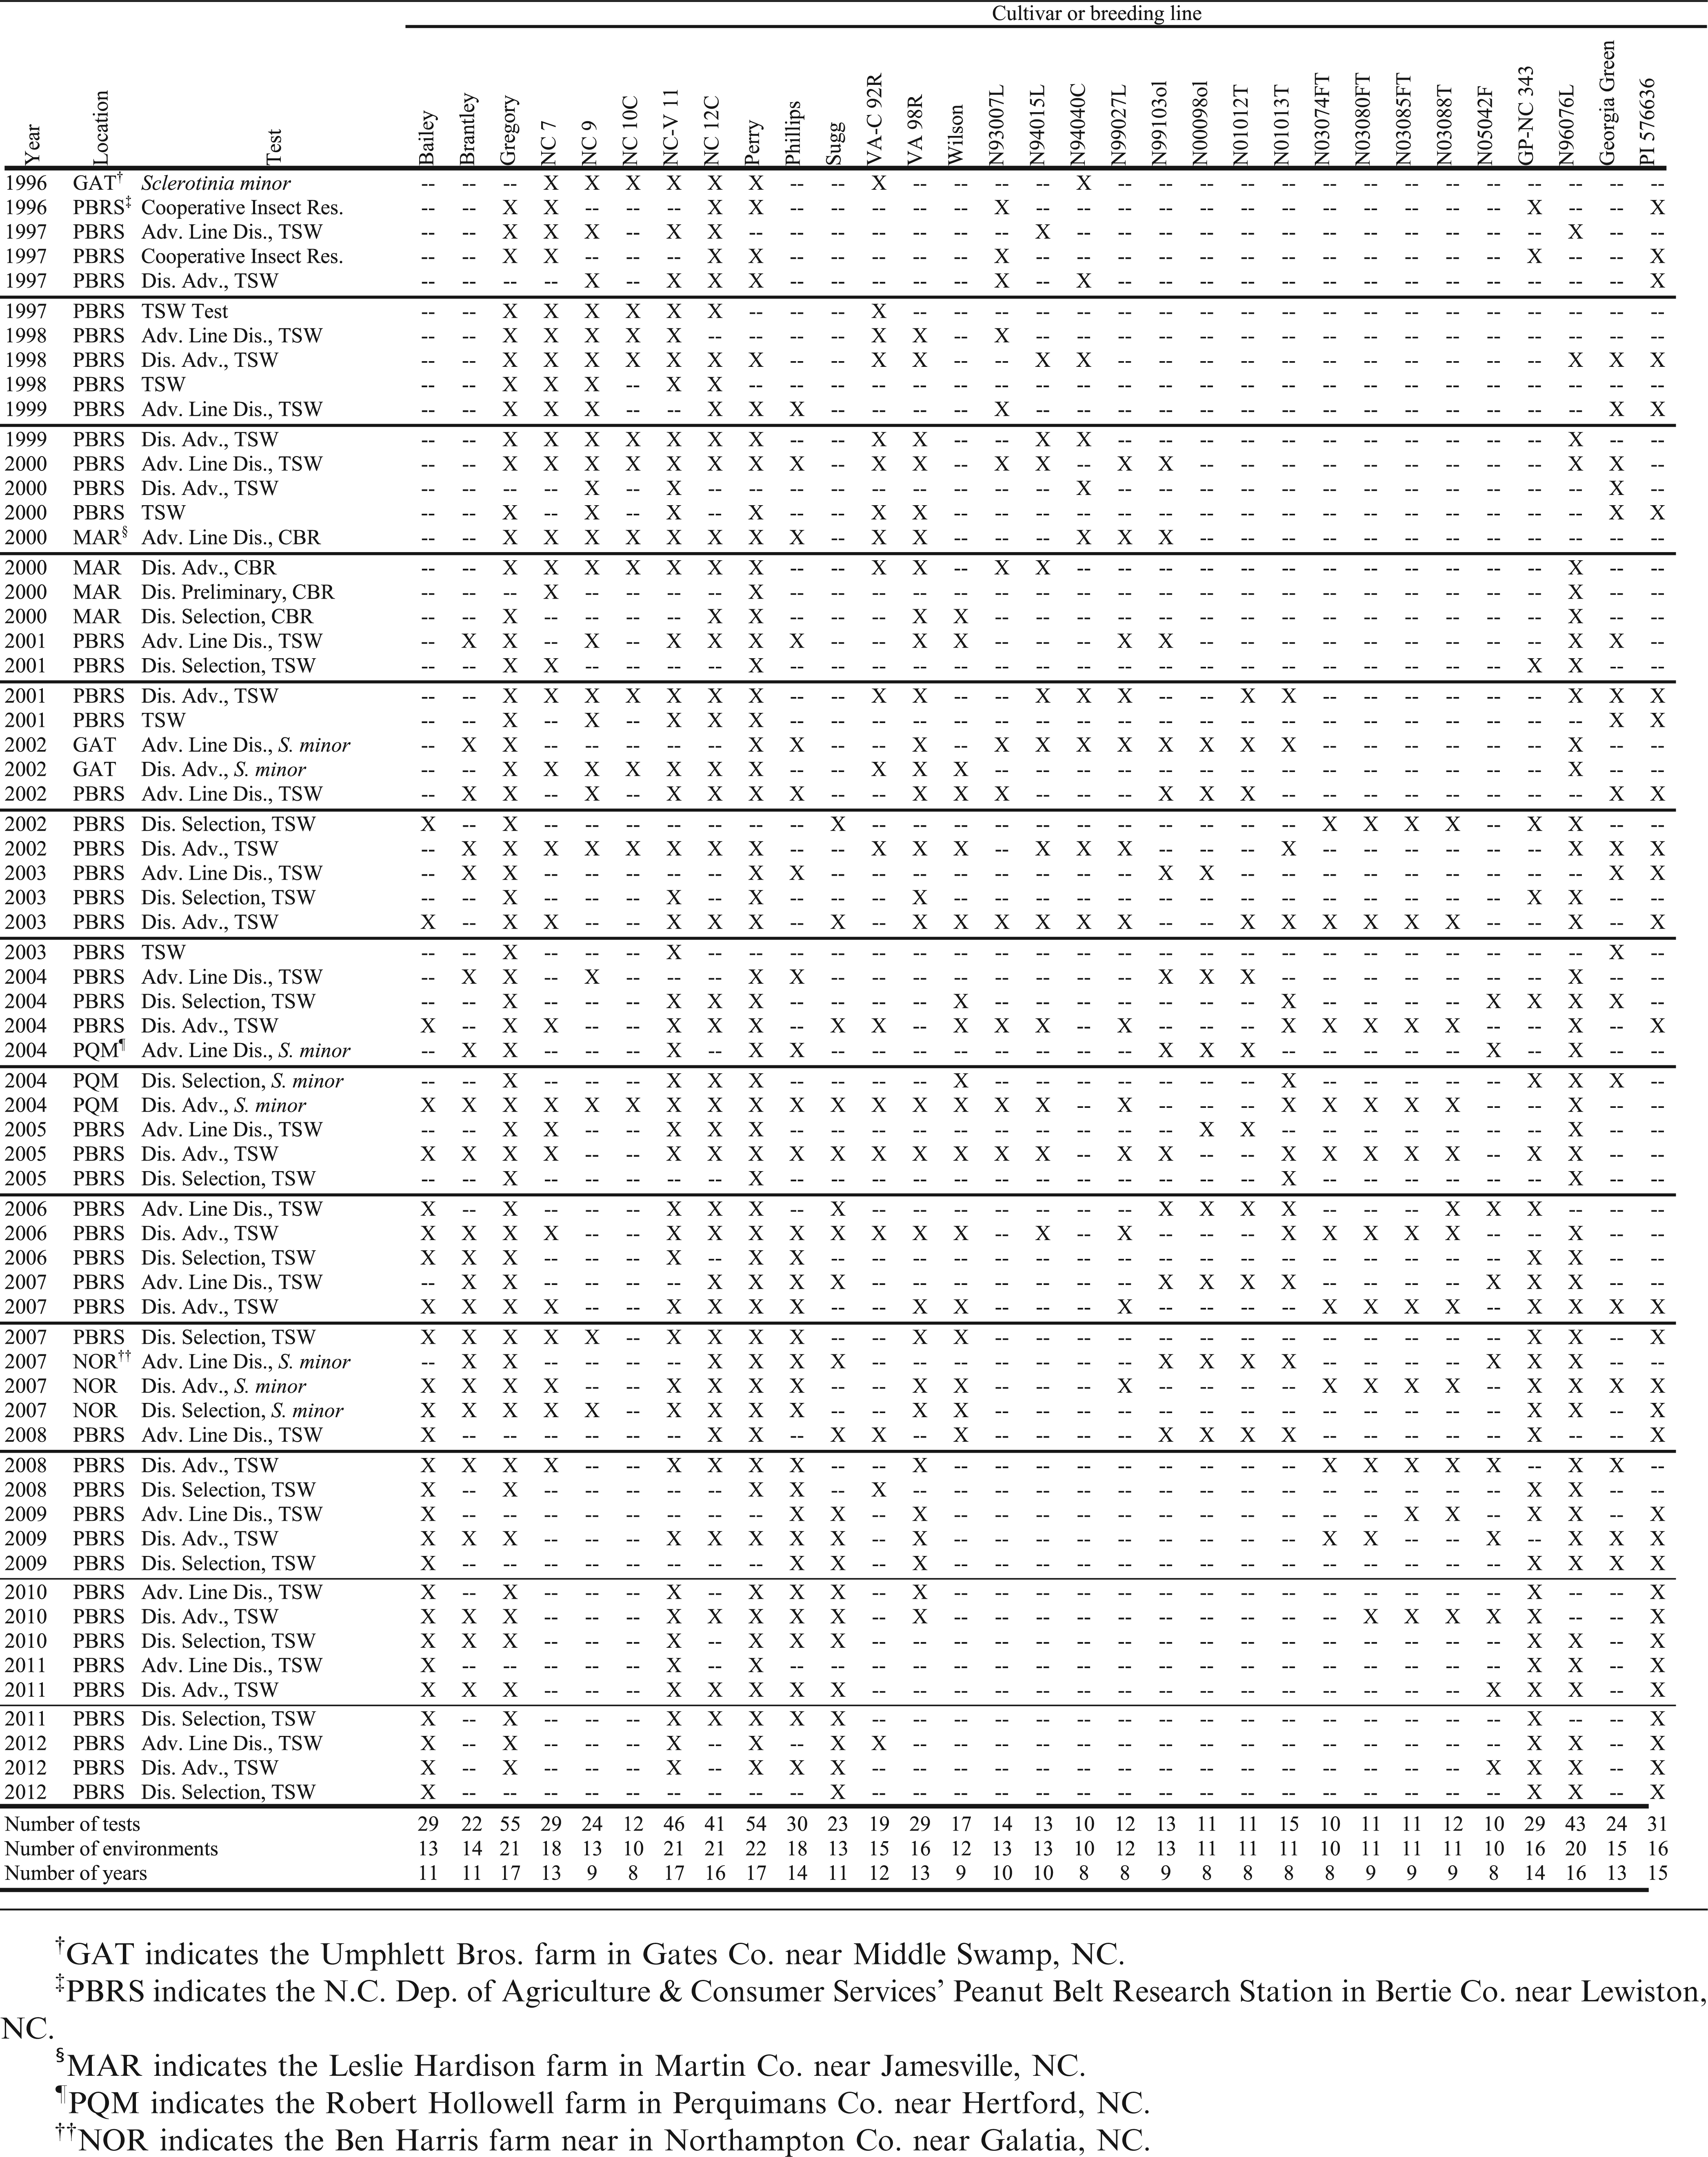
Distribution of data points collected on 31 peanut cultivars and breeding lines from 1996 through 2012.
Statistical Analysis
Data were analyzed using the general linear models procedure (PROC GLM) of the SAS statistical software package (SAS Institute, Cary, NC). Initially, analysis of variance was performed, removing environments (defined for this analysis as combinations of years and locations), tests within environments, genotypes, and GxE interaction as sources of variation, leaving interaction between genotypes and tests within environments as the residual error. Means for environments adjusted to a common genotypic effect were estimated using the LSMEANS statement of PROC GLM.
The linear model for partitioning of genotype-by-environment interaction was:

where Yijk was the TSW incidence in kth genotype in the jth test in the ith environment; μ was the mean of all observations; Ei was the effect of the ith environment; Tij was the effect of the jth test in the ith environment; Gk was the effect of the kth genotype, 1+βk was the slope of regression of incidence in the kth genotype on the effect of the ith environment, δik was the deviation from regression, and εijk was the residual error term. Note that because the slope of regression on the environmental effect was defined as 1+βk, the βk's represent the deviation of the slope from unity. In a balanced design, this would imply that the sum of the βk's across all genotypes must be zero. A design matrix was developed to partition the variation among genotypes, environments, and regression of TSW incidence on the environmental effect. Genotypic and environmental effects were parameterized so as to sum to zero when unweighted by the frequency of the genotype or environment among the data. Environmental effects were estimated as the deviation of the environmental mean adjusted to a common genotypic effect from the grand mean. Estimates of genotypic effects and slopes were compared with critical values (zero for effects and unity for slopes) using t tests and also subjected to mean separation using protected t-tests.
Results and Discussion
The conventional analysis of variance for TSW incidence indicated that there were significant differences among the 22 environments, among tests within environments, and among the 31 genotypes. Overall GxE interaction was not significant (P = 0.0644) (Table 3). However, partition of the GxE sum of squares revealed significant variation among the regression slopes of the 31 genotypes. The aggregate deviation from linear regression was not significant (P = 0.286).
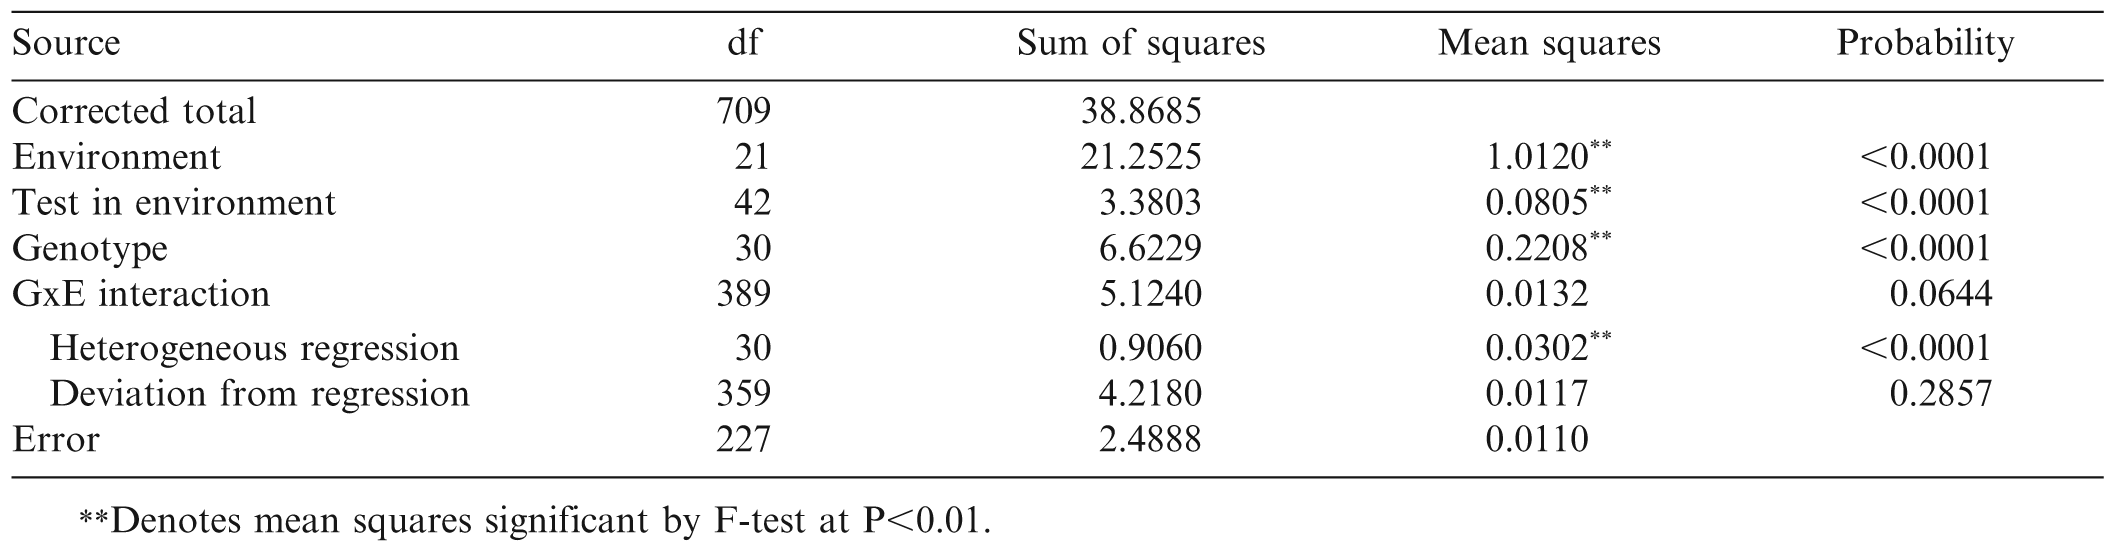
Mean squares from analysis of variance of TSW incidence.
As mentioned above, the trials conducted in 2000, 2001, and 2002 had the greatest mean levels of TSW incidence (34, 68, and 55%) while mean incidence in 1996–1999 was less than 15% and in 2003–2012 ranged from 20% to 50%. This variation in TSW incidence over years is well documented, but has not been fully explained by weather (Olatinwo et al., 2008) or evolution of the virus (Kaye et al., 2009). As a point of reference, the mean effect of Georgia Green, the standard TSW-resistant runner-type cultivar, was actually slightly greater than zero (+0.054±0.023, P = 0.0180), and its slope of regression did not differ from one (Table 4, Fig. 1). Georgia Green's performance in these tests was close to the mean of all lines. Eight virginia-type cultivars from N.C. State Univ. (NC 7, NC 9, NC 10C, NC-V 11, NC 12C, Perry, Phillips, and Brantley) had susceptible reactions with mean effects greater than zero (P<0.01). Six of the eight had estimates of βk greater than zero (P<0.05). Only one cultivar, Bailey, had a mean effect and β̂k less than zero (P<0.05). Clearly Bailey exhibited resistance both in terms of its mean level of TSW and in its reaction to increasingly severe disease (Table 4, Fig. 1). Among the breeding lines, several had mean effects significantly (P<0.05) less than zero, including N94015L, N99027L, and Bailey siblings N03074FT, N03080FT, N03085FT, and N03088T. Bailey and its siblings apparently derive their field resistance to TSW from their non-recurrent parent N96076L rather than from recurrent parent NC 12C which was found to be susceptible.
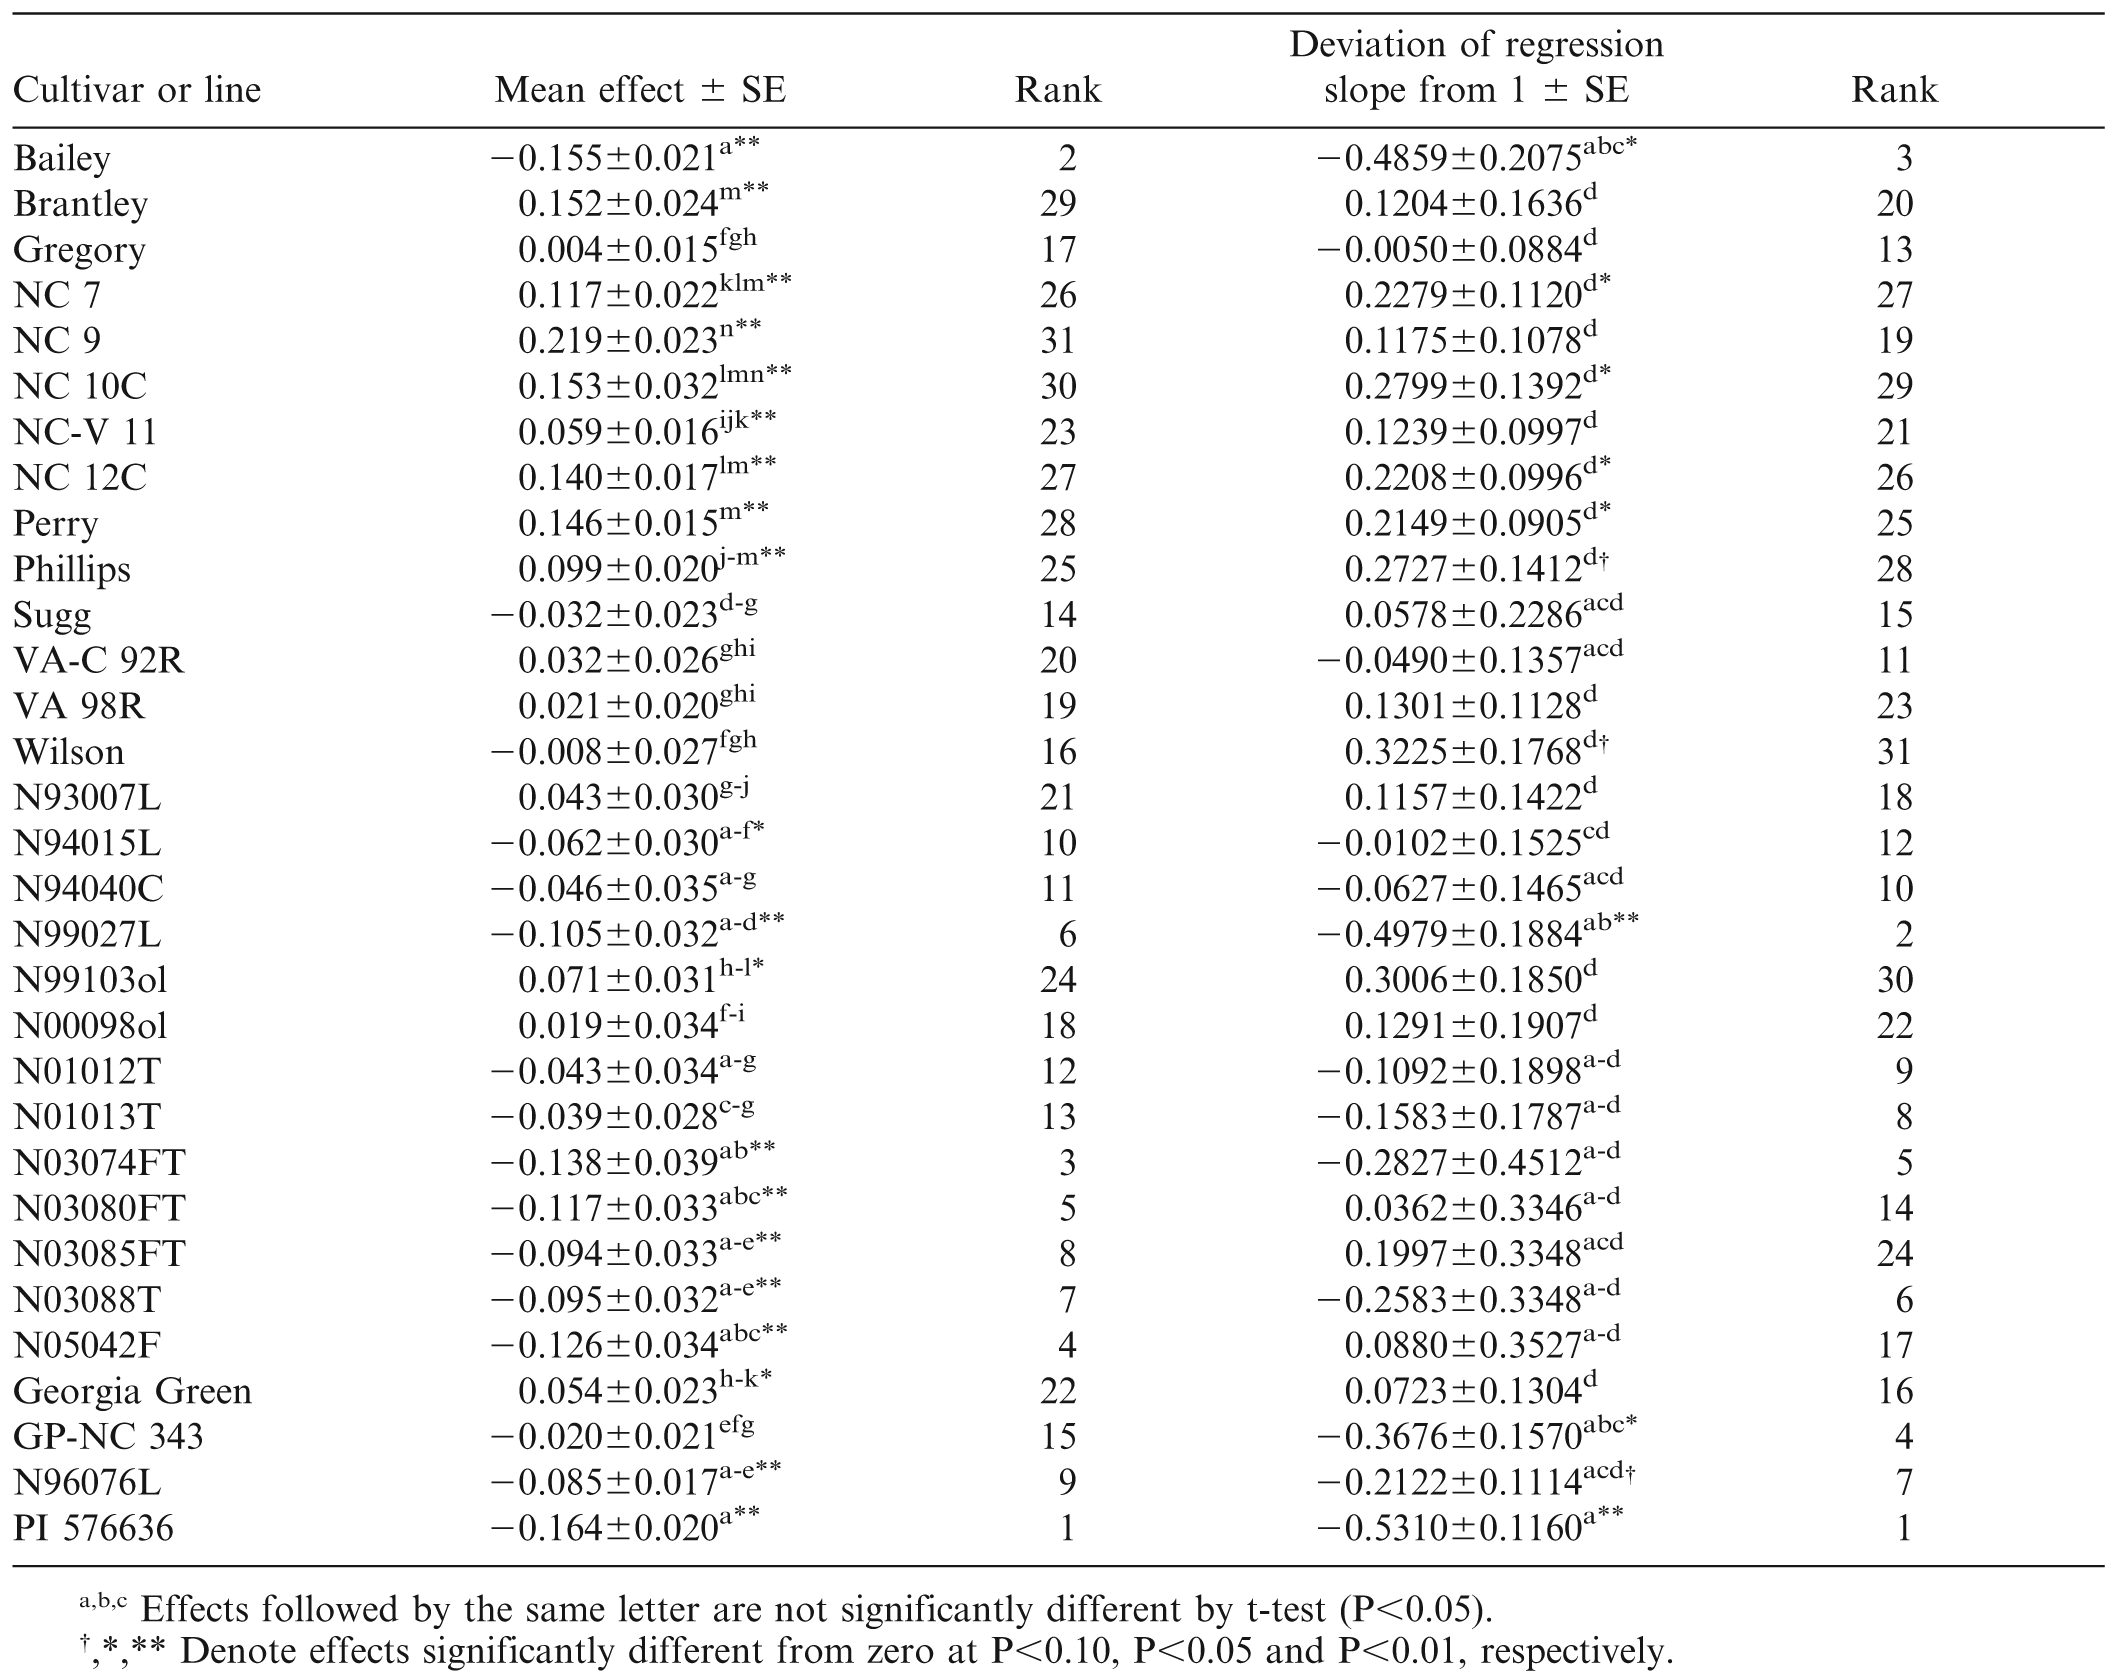
Mean effect and deviation of regression on environmental index from one (β̂k) for 30 peanut cultivars and breeding lines.
The heterogeneous slopes of regression on the environmental index resolved into only four statistical groups. For Bailey, β̂k = −0.49, indicating that Bailey had a fairly flat response to increasing general level of TSW. None of Bailey's siblings, all of which were tested in the same array of environments as Bailey, had a value of β̂k significantly different from zero, indicating that, unlike Bailey, they would be expected to exhibit greater incidence of TSW in increasingly severe environments.
The Bailey siblings were not the only closely related group to share similar responses to TSW. N99103ol is a high-oleic line derived from the first backcross in a program to transfer the trait from the Univ. of Florida's F435 (Moore and Knauft, 1989) into NC 9, a very TSW-susceptible cultivar. Although N99103ol had a lower mean effect than NC 9 (0.07 vs. 0.22, P<0.05), its β̂k was numerically but not statistically greater (0.365 vs. 0.184, NS). Similarly, N00098ol is a backcross-derived high-oleic version of Gregory, a cultivar long considered to manifest partial field resistance to TSW. Because it was selected from the second backcross to its recurrent parent, N00098ol should be even more similar to Gregory than N99103ol is to NC 9. Neither the mean effect (0.019 vs. 0.004, NS) nor the β̂k (0.129 vs. -0.005, NS) of N00098ol was different from that of Gregory.
PI 576636 was introduced from central Mexico in 1993 as part of a group of hirsuta-type collections that included PI 576638, the TSW-resistant hirsuta-type parent of Univ. of Florida breeding line NC94022 (Culbreath et al., 2006). PI 576636 was found to combine superior field resistance to TSW with adequate adaptation to the growing conditions of North Carolina (data not shown). It has been used as a TSW-resistant check in the N.C. State Univ. breeding program for a number of years, including all but two of those represented in the current study. In this study, the field resistance of PI 576636 to TSW is confirmed, especially in light of its having been tested in the period of greatest average incidence of TSW, the period 2000–2002 (Table 4, Fig. 1).
The results of the stability analysis suggest that Bailey may be as field resistant as PI 576636, but it is clear that trials of Bailey in more severe TSW environments would be desirable. Across the 31 cultivars and breeding lines used in this study, the correlation of mean effect with β̂k was r = 0.693 (P<0.01) while the rank correlation was rrank = 0.722 (P<0.01). With the mean effect accounting for approximately 50% of the variability in β̂k, one might conclude that calculation of the mean effect is sufficient. However, with the false-positive example of Perry in mind, it is clear that the remaining half of the variation in β̂k is unpredictable and that application of the stability analysis does contribute to better understanding of the reaction of lines to increasing general levels of TSW.
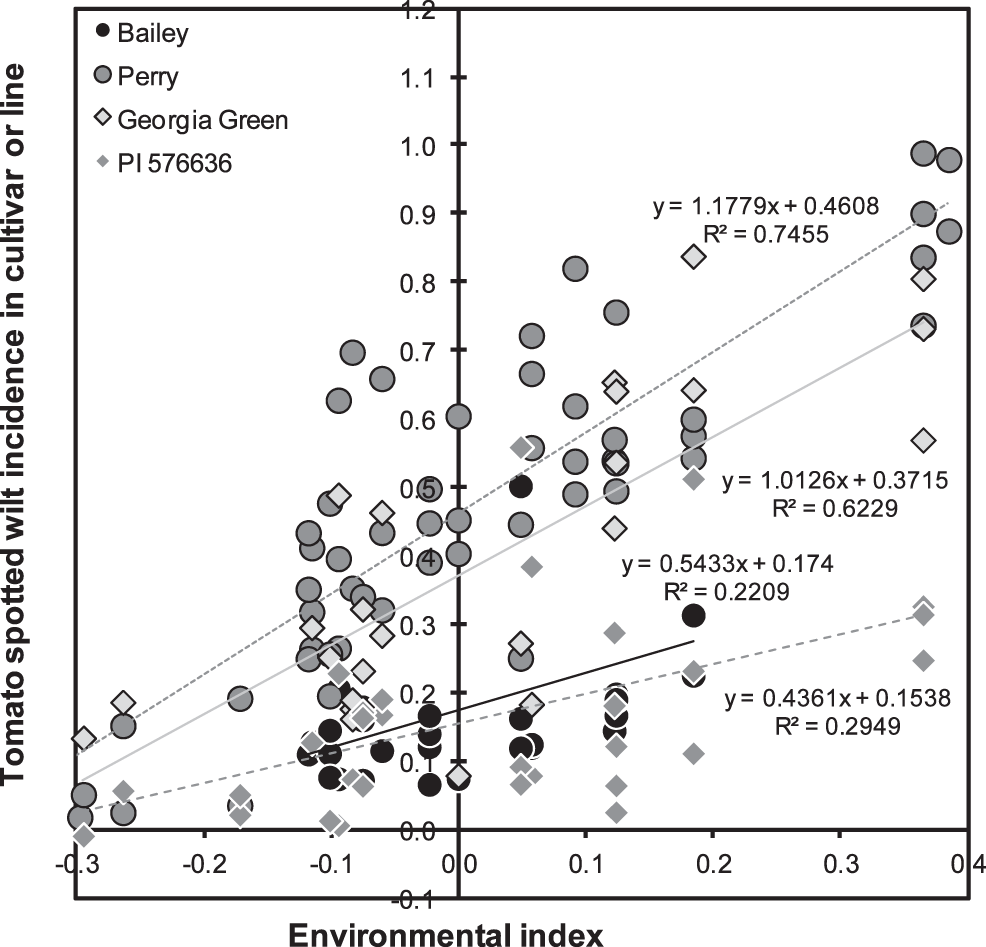
Tomato spotted wilt (TSW) reactions of Bailey, Perry, Georgia Green, and PI 576636 versus environmental indices across 22 environments in 17 years.
Literature Cited
Branch W.D 1991 Registration of ‘Georgia Runner’ peanut Crop Sci. 31 ( 2 ): 485 .
Branch W.D 1996 Registration of ‘Georgia Green’ peanut Crop Sci. 36 : 806 .
Campbell W.V Emery D.A and Gregory W.C 1971 Registration of GP-NC343 peanut germplasm (Reg. No. GP 1) Crop Sci. 11 – 605 .
Cockerham C.C 1963 Estimation of genetic variances, pp. 53 – 94 In Hanson W.D and Robinson H.F (eds.) Statistical Genetics and Plant Breeding. Nat. Acad. Sci. - Nat. Res. Counc. Publ. 982. Washington, DC .
Comstock R.E and Moll R.H 1963 Genotype-environment interactions, pp. 164 – 194 In Hanson W.D and Robinson H.F (eds.) Statistical Genetics and Plant Breeding. Nat. Acad. Sci. - Nat. Res. Counc. Publ. 982. Washington, DC .
Culbreath A.K Gorbet D.W Martinez-Ochoa N Holbrook C.C Todd J.W Isleib T.G and Tillman B 2006 High levels of field resistance to tomato spotted wilt virus in peanut breeding lines derived from hypogaea and hirsuta botanical varieties Peanut Sci. 32 : 20 – 24 .
Eberhart S.A and Russell W.A 1966 Stability parameters for comparing varieties Crop Sci. 6 : 36 – 40 .
Finlay K.W and Wilkinson G.N 1963 The analysis of adaptation in a plant breeding programme Aust. J. Agric. Res. 14 : 742 – 754 .
Gorbet D.W and Shokes F.M 2002 Registration of ‘C-99R’ peanut Crop Sci. 42 : 2207 .
Isleib T.G Milla-Lewis S.R Pattee H.E Copeland S.C Zuleta M.C Shew B.B Hollowell J.E Sanders T.H Dean L.O Hendrix K.W Balota M and Chapin J.W 2011 Registration of ‘Bailey’ peanut J. Plant Reg. 5 : 27 – 39 [doi:10.3198/jpr2009.12.0742crc] .
Isleib T.G Rice P.W Bailey J.E Mozingo R.W and Pattee H.E 1997 Registration of ‘NC 12C’ peanut Crop Sci. 37 ( 6 ): 1976 .
Isleib T.G Rice P.W Mozingo R.W Copeland S.C Graeber J.B Novitzky W.F Pattee H.E Sanders T.H Mozingo R.W and Coker D.L 2006a Registration of ‘Brantley’ peanut Crop Sci. 46 : 2309 – 2311 .
Isleib T.G Rice P.W Mozingo R.W Copeland S.C Graeber J.B Pattee H.E Sanders T.H Mozingo R.W and Coker D.L 2006b Registration of ‘Phillips’ peanut Crop Sci. 46 : 2308 – 2309 .
Isleib T.G Rice P.W Mozingo R.W Copeland S.C Graeber J.B Shew B.B Smith D.L Melouk H.A and Stalker H.T 2006c Registration of N96076L peanut germplasm Crop Sci. 46 : 2329 – 2330 .
Isleib T.G Rice P.W Mozingo R.W Mozingo R.W Bailey J.E and Pattee H.E 2003 Registration of ‘Perry’ peanut Crop Sci. 43 : 739 – 740 .
Isleib T.G Rice P.W Mozingo R.W Mozingo R.W and Pattee H.E 1999 Registration of ‘Gregory’ peanut Crop Sci. 39 : 1526 .
Jenns A.E Leonard K.J and Moll R.H 1982 Stability analyses for estimating relative durability of quantitative resistance Theor. Appl. Genet. 63 : 183 – 192 .
Kaye A.C Moyer J.W Parks E.J Cargone I and Cubeta M.A 2011 Population genetic analysis of Tomato spotted wilt virus on peanut in North Carolina and Virginia Phytopathology 101 : 147 – 153 .
Lin C.S Binns M.R and Lefkovitch L.P 1986 Stability analysis: Where do we stand ? Crop Sci. 26 : 894 – 900 .
Moore K.M and Knauft D.A 1989 The inheritance of high oleic acid in peanut J. Hered. 80 : 252 – 253 .
Mozingo R.W Coffelt T.A and Isleib T.G 2000 Registration of ‘VA 98R’ peanut Crop Sci. 40 : 1202 – 1203 .
Mozingo R.W Wynne J.C Porter D.M Coffelt T.A and Isleib T.G 1994 Registration of ‘VA-C 92R’ peanut Crop Sci. 34 ( 2 ): 539 .
Mozingo R.W Coffelt T.A Swann C.W and Phipps P.M 2004 Registration of ‘Wilson’ peanut Crop Sci 44 : 1017 .
Olatinwo R.O Paz J.O Brown S.L Kemerait R.C Culbreath A.K Beasley J.P and Hoogenboom G 2008 A predictive model for spotted wilt epidemics in peanut based on local weather conditions and the tomato spotted wilt virus risk index Phytopathology 98 : 1066 – 1074 .
Plaisted R.L and Peterson L.C 1959 A technique for evaluating the ability of selections to yield consistently in different locations or seasons Am. Potato J. 36 : 381 – 385 .
Shew B.B 2005 Peanut disease management , pp. 79 – 102 In 2005 Peanut Information. N.C. Coop. Ext. Serv. AG-331 (Revised) .
Shew B.B Sommartya T and Beute M.K 1989 Components of partial resistance in peanut genotypes to isolates of Cercosporidium personatum from the United States and Thailand Phytopathology 79 : 136 – 142 .
Shukla G.K 1972 Some statistical aspects of partitioning genotype-environmental components of variability Heredity 29 : 237 – 245 .
Wells M.L Culbreath A.K Todd J.W Brown S.L and Gorbet D.W 2002 A regression approach for comparing field resistance of peanut cultivars to tomato spotted wilt tospovirus Crop Protection 21 ( 6 ): 467 – 474 doi: 10.1016/S0261-2194(01)00134-X .
Wynne J.C Beute M.K Bailey J and Mozingo R.W 1991a Registration of ‘NC 10C’ peanut Crop Sci. 31 : 484 .
Wynne J.C Coffelt T.A Mozingo R.W and Anderson W.F 1991b Registration of ‘NC-V11’ peanut Crop Sci. 31 : 484 – 485 .
Wynne J.C Mozingo R.W and Emery D.A 1979 Registration of NC 7 peanut (Reg. No. 22) Crop Sci. 19 : 563 .
Wynne J.C Mozingo R.W and Emery D.A 1986 Registration of ‘NC 9’ peanut Crop Sci. 26 : 197 .
Notes
- T.G. Isleib, S.R. Milla-Lewis, W.B. Dong, and S.C. Copeland, Dep. of Crop Sci., Box 7629, N.C. State Univ., Raleigh, NC 27695-7629
- B.B. Shew, Dep. of Plant Pathology, Box 7903, N.C. State Univ., Raleigh, NC 27695-7903
- C. Arellano, Dep. of Statistics, Box 8203, N.C. State Univ., Raleigh, NC 27695-8203 * Corresponding author. E-mail: tom_isleib@ncsu.edu.
Author Affiliations