

Near infrared spectroscopy (NIRS) techniques have become more common in food quality analysis. NIRS has been used to detect the harmful pathogens in milk, dairy products, meat and eggs (Pérez-Vich et al., 1998; Velasco and Becker, 1998; Daun et al., 1994). NIRS works on the principle of interaction of electromagnetic radiation with matter and the energy transfer. The spectral response for larger samples, such as whole grain, in the NIR region was found to be more pronounced than in the mid IR region. Thus, NIR spectra can be obtained on whole samples without the additional work of sample preparation. Electromagnetic response in the NIR region is primarily from the vibration response of O-H, C-H, C-O and N-H molecular bonds. Hydrogen bonds have more spectral stability in the NIR region, which helps greatly in food quality analysis, and may yield possible structural information of the chemical composition of the food material. Food components such as water, ethanol, sugars (fructose and glucose), organic acids, fatty acids, phenolic compounds, and food oxidative products contain many chemical bonds that absorb energy in the NIR spectrum, facilitating the application of NIRS in the measurement of food quality ( Sundaram et al., 2010a,b).
NIRS is useful for the quantitative measurement of composition and constituents such as, protein, carbohydrates, moisture content, oil content, fatty acid, acidity, total soluble solids, as well as physical properties such as freshness, color and maturity measurements of food materials ( Sundaram et al., 2010a,b, Windham et al., 2010). Combining NIR measurements with chromatographic techniques would be helpful for the identification and quantification of chemical constituents present in the food and agricultural products. The NIR technique was first used in 1964 for the measurement of moisture in agricultural products (Norris, 1964). After that, it was applied to moisture measurement of grain and oil seeds in 1965 by Norris and Hart (Norris and Hart, 1965). Since then, it has been used in the grain industries for the rapid measurements of oil, protein and moisture (Rosenthal, 1973).
In the peanut industry, peanuts are shelled and graded by Federal-State Inspection Service to determine the price paid to the grower. The overall grade of the peanuts is determined by considering different quality factors such as moisture content, meat content, and size of pods, kernel size, damaged kernels and foreign material present in the peanuts. Peanut samples of a recommended weight are cleaned, shelled and subjected to different tests. Similarly, while the peanuts are processed for making them into different commercial products it is important to know the moisture content, total oil content, fatty acid profile, protein and starch present.
Holman and Edmondson (1956) and Murray (1987) studied the near-infrared spectra of homologous series of fatty acids. Based on these studies, NIRS has been used to differentiate various types of oils, and to estimate the fatty acid composition of the oil in intact-seeds of rapeseed, mustard, and husked sunflower seeds (Panforda and DeManb, 1990; Bhatty, 1991; Sato, 2002). NIRS was first applied to determine oil, protein, water, and fiber contents in sunflower meal samples (Robertson and Barton, 1984 and Kaffka et al.,1982), and later for fatty acid composition (Sato et al.,1995). Oil, protein, chlorophyll and glucosinolate content of whole rapeseed kernels were also analyzed using NIRS by Tkachuk et al., (1988). Nimaiyar et al., (2004) used Fourier-Transform (FT) NIRS to develop calibrations equations to measure palmitic, stearic, oleic, linoleic and linolenic acids in soybeans. FT-NIR calibration models predicted the fatty acids with correlation coefficients ranging from 0.49 to 0.87, Root Mean Square Error of Prediction values from 0.39% to 3.46% of total oil and RPD values from 1.0 to 1.9 for the five fatty acids.
It is well documented that NIRS could be used successfully for the measurement of protein, moisture, oil content and fatty acid composition of peanuts. Misra et al., (2000) used NIRS for measuring the oil content in different cultivars of peanuts from different harvests. Tillman et al., (2006) showed that NIRS could be used for the nondestructive determination of oleic and linoleic acid concentrations in single peanut seeds. During the breeding programs, breeders usually acquire small quantities of samples for testing, and the ability to analyze the samples nondestructively would be valuable to them. NIRS analysis could be performed rapidly compared to other conventional methods such as gas chromatography and it does not need any sample preparation. Working with larger sample groups instead of single seeds during NIRS analysis would be useful in analyzing bulk samples.
Materials and Methods
Peanut Samples
Thirty genotypes of runner-type peanut seeds were used in this study (Table 1). These genotypes were derived from nine crosses with considerable variations of oleic acid content. Seeds were provided by the peanut breeding program at USDA-ARS National Peanut Research Laboratory and were harvested in fall 2007 either in Headland, AL or Brownfield, TX. High oleic content lines among 30 genotypes were contributed by five high oleic donor parents: ‘F435’, ‘Sunoleic 95R’, ‘AT108-HO’, ‘AT-50-1114’, and ‘GK-7-HO’ (Table 1). All seeds were dried to a safe moisture level of ≤ 10.5%, wet basis (USDA, 2000). Petroleum ether (Fisher Chemicals, USA) was used for oil extraction. Cyclohexane, acetone and sodium methoxide (Sigma-Aldrich, St. Louis, MO, USA) were used to prepare oil samples for fatty acid analysis using gas chromatography, to develop fatty acid reference values ( Sundaram et al., 2010a).
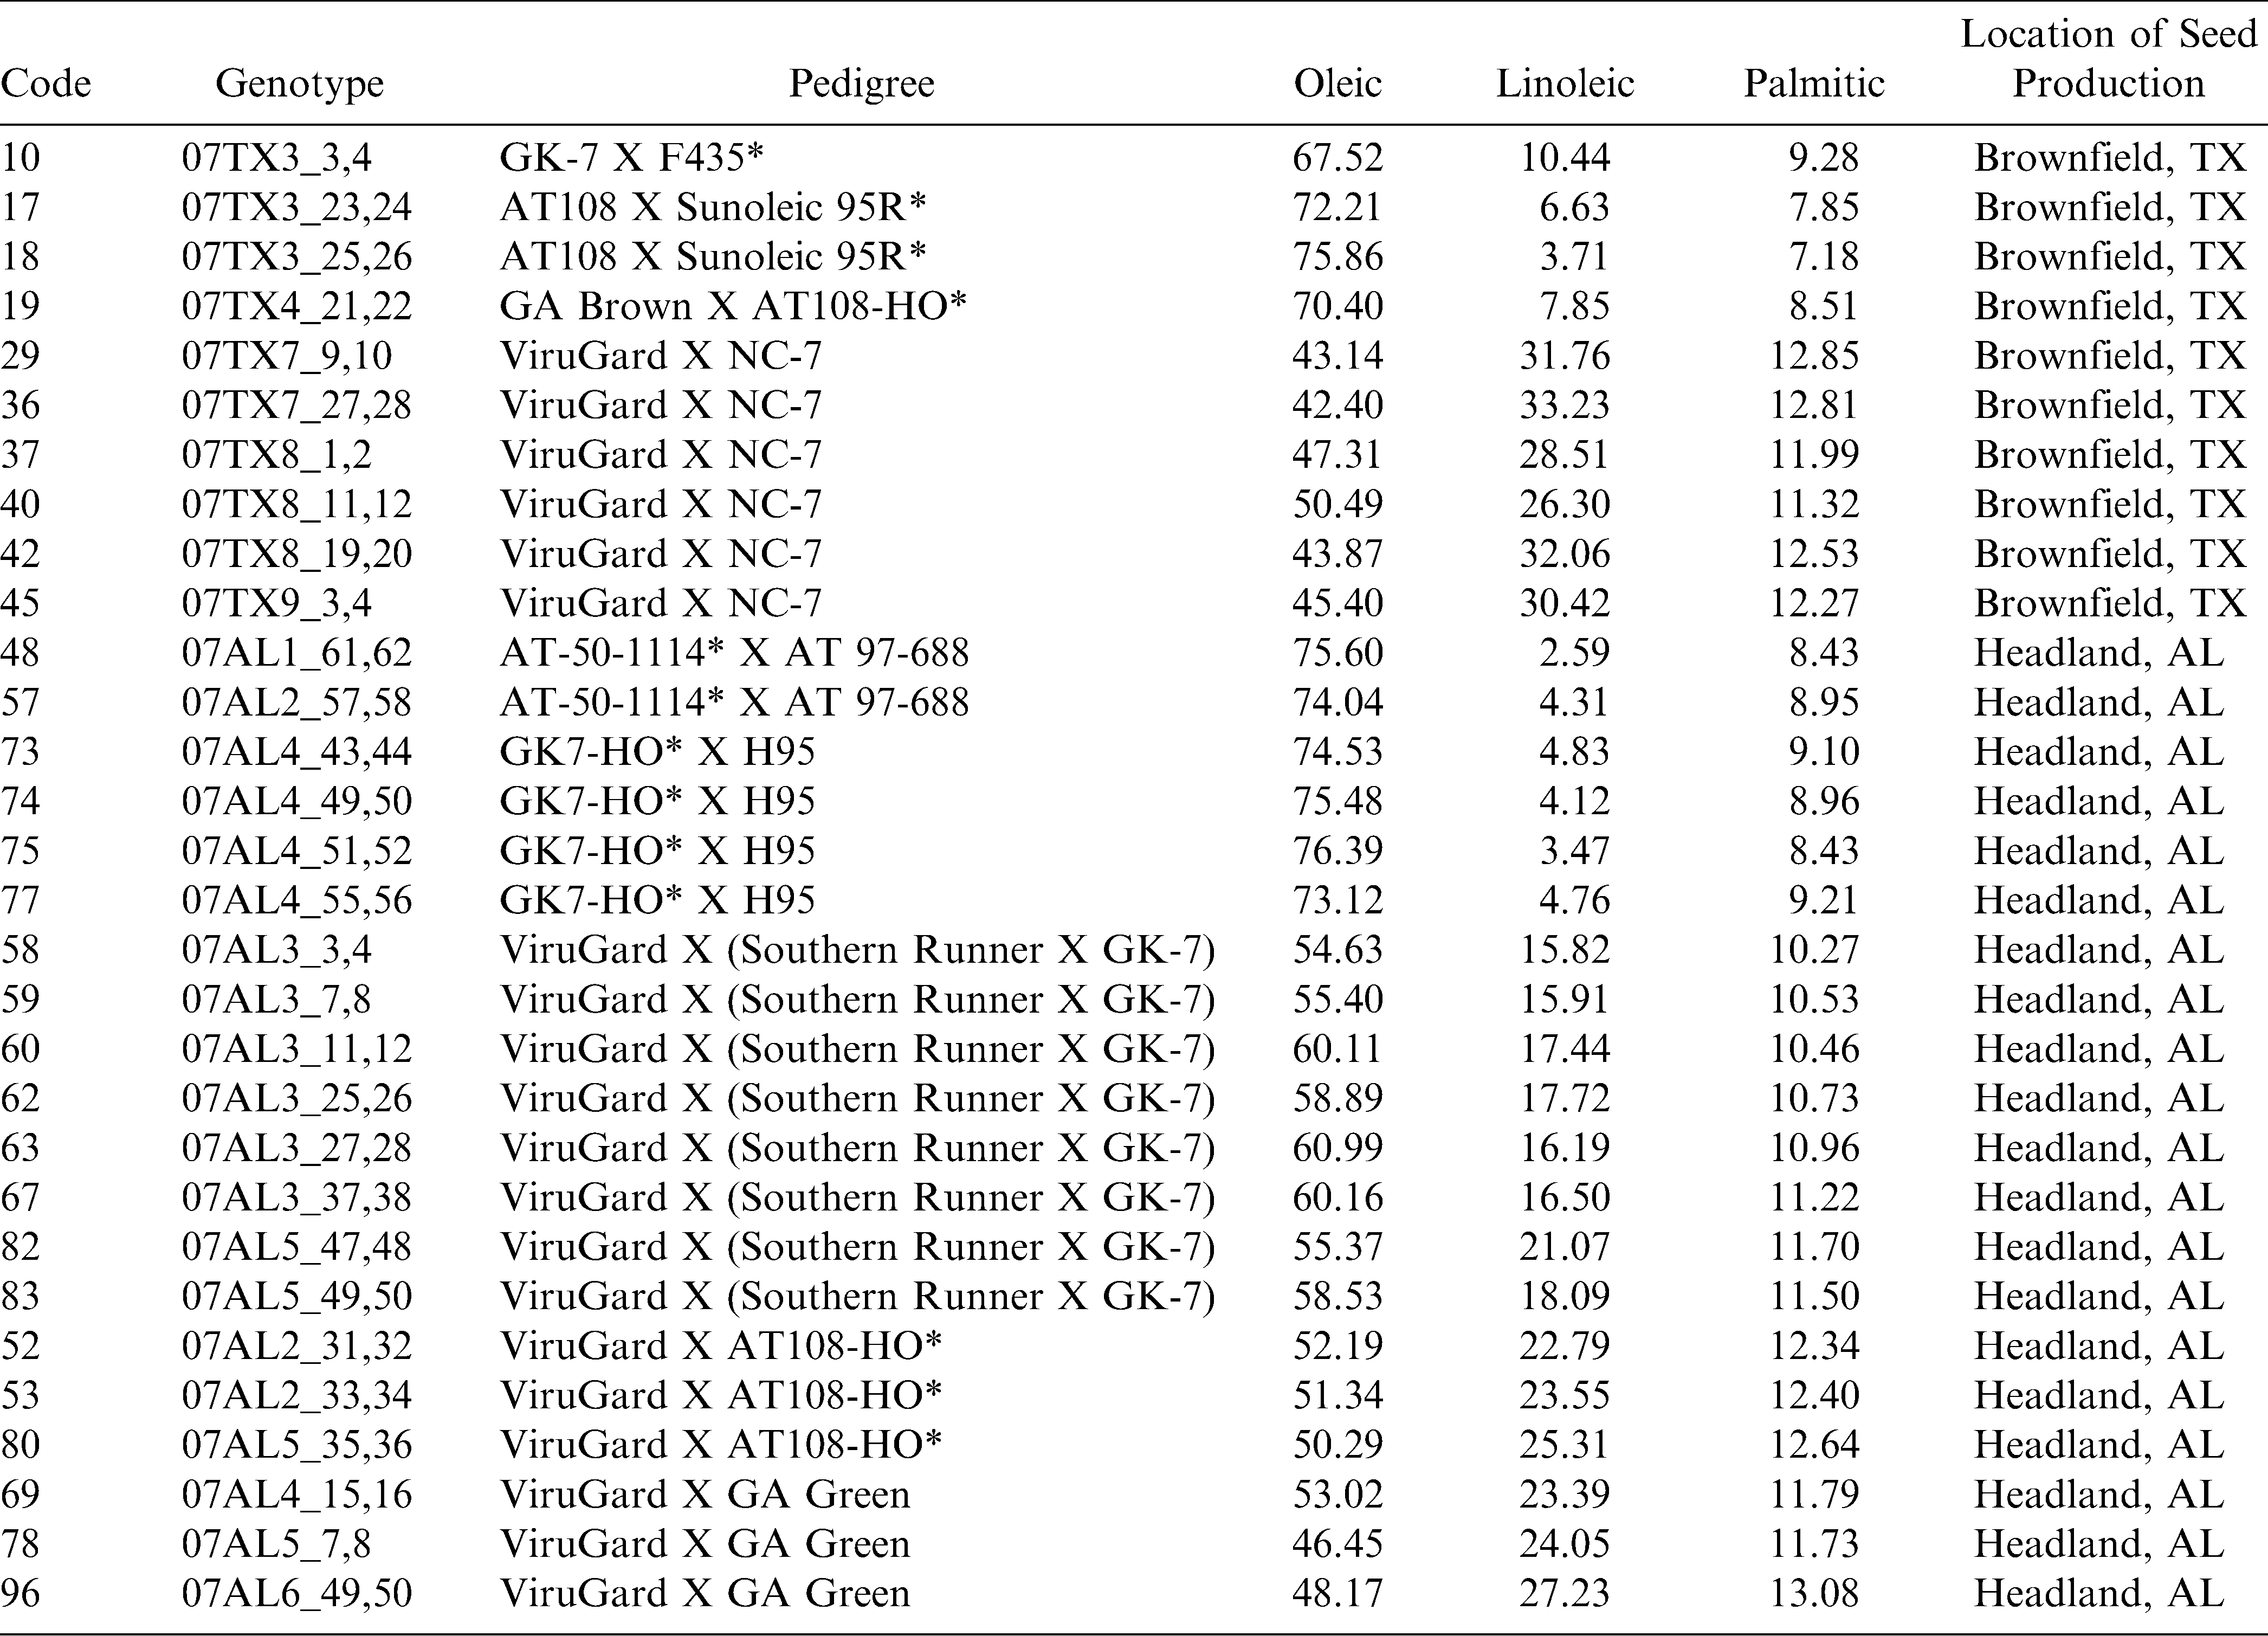
The pedigree information and high oleic donor parents of thirty genotypes used in the test.
Oil extraction
A Soxtec 3 semi automatic method was used to extract the total oil from peanut samples with petroleum ether. Well-developed and intact kernels were selected from the different cultivars of the peanuts for the measurements. Kernel samples were frozen before grinding to avoid loss of any oil while grinding. About one gram of homogeneously ground fine peanut meal was weighed and placed in a cellulose thimble. The thimble was covered using a thin layer of defatted cotton, to avoid any spilling of petroleum ether. The thimble was fixed on to a metal ring through which the thimble could be attached to the Soxtec extractor. Metal cups were placed below each of the thimble to collect the extracted oil from a sample. Weights of the empty cups were recorded and the cups were placed on the metal plate. About 90 ml of petroleum ether was added to each thimble from the top. Thimbles were heated to boil the petroleum ether. While boiling, the petroleum ether extracted oil contained in the peanut meal. Temperature was maintained at 135°C ± 2°C during boiling, for 45 minutes. By end of the boiling time, petroleum ether and oil mixture was collected in the metal cups placed below the thimbles. Heating the collection cups was continued for another 45 minutes at 135°C ± 2°C to evaporate the petroleum ether from the mixture. The cups were cooled for 15 minutes. During the cooling process, evaporated petroleum ether that had condensed was collected separately. The collecting cups were removed and kept in a hot-air oven at 40°C for 30 minutes to drive out any traces of petroleum ether. From the weights of, empty collecting cups, cups with oil, and initial ground peanut kernel meal, the total oil percentage was calculated. The measurements were done in triplicate for each cultivar ( Sundaram et al., 2010a).
Fatty acid analysis
Fatty acids present in the peanut samples were analyzed using Gas Chromatography (GC) (Agilent Technologies, 6890N Network GC). Oils extracted from each peanut group, using the method described above, were used for fatty acid analysis. About 10–12 mg of the extracted peanut oil was reacted with 0.2 ml of sodium methoxide to convert the fatty acids into corresponding esters. To complete this process, the oil and sodium methoxide mixture was heated to 50°C, and thoroughly mixed using a sonicator until it was derivatized completely. About 0.5 ml of cyclohexane was then added to the mixture to recover the derivatized esters and the whole mixture was sonicated for about 10–15 minutes and allowed to undergo phase separation. From the upper phase, 10–20 µl was withdrawn and diluted using one ml of acetone. This mixture was taken in a glass vial and analyzed using a GC fitted with a SP 2380 fatty acid column. The oven temperature in GC was maintained at 185°C. Hydrogen, air, and helium gas flow rates were 40, 450 and 0.6 ml/minute respectively. One µl of the sample was injected for each measurement. Total run time was 20 minutes. Within 20 minutes, esters of all major fatty acids namely oleic, linoleic and palmitic acids were separated and well-identified. Before running the oil samples, a fatty acid methyl ester (FAME) standards were run by diluting FAME in acetone. Based on the FAME peak references peanut fatty acid peaks were identified.
NIRS measurements
The peanut seed samples were separated into calibration and validation groups. NIRS measurements were made using a scanning monochromator (Model 6500, FOSS NIRSystems, Silver Springs, MD, USA). Spectral data were collected using Vision software (Version 1.0, FOSS NIRSystems, Silver Springs, MD, USA). Each replicate sample consisted of 100–200 g of peanut seeds depending on the amount required to adequately fill the sample holder. The room temperature during the measurements varied from 21°C to 23°C. NIR light passed through the bottom of the sample holder and was incident on the in-shell peanuts. The transmitted and reflected energy spectrum over the wavelengths of 400 nm to 2500 nm that carried absorption information of the samples was collected. This spectral data was collected for 30 replicates of each peanut cultivar.
Data analysis
NIRS data were analyzed using multivariate data analysis software (Unscrambler Version 9.7 CAMO ASA, USA). Reflectance spectra between 400–2500 nm with 0.5 nm intervals were taken as independent variables. Fatty acid concentration was the dependent variable in the analysis. Using the spectral data from the calibration dataset, partial least square (PLS) regression analysis was conducted to develop an empirical equation to estimate the concentrations of oleic, linoleic and palmitic acids. Before analysis, raw data often needs mathematical pretreatments to remove any defects in the spectra. Before applying the PLS analysis, absorption spectral data were converted in to reflectance spectral data. The derivatives of the absorption and reflection spectral data with respect to wavelength were computed. The derivative computation was used to remove any baseline shifting that may have occurred and to avoid overlapping of peaks. The fatty acids constitute a small fraction (less than 5%) of the mass index of total oil and moisture contents in the samples, and their spectral characteristics could be easily overshadowed by the total oil and moisture contents. By applying the derivative treatment, the modified wavelength spectrum showed more details by diminishing the influence of the lower frequencies, which hides the clarity of the spectral signatures and enhances the higher frequencies to show the spectral signature of fatty acids clearly. However, the derivative treatment was limited to second order because at higher orders excessive smoothing may take place that would diminish the contributions of the characteristic peaks.
Results and Discussion
The NIR region selected for fatty acid analysis was 1600–2400 nm, because the absorption bands of cis-unsaturation and length of carbon chain in fatty acids appear around this region of wavelengths (Panforda and DeManb, 1990). The primary NIR absorption spectra of peanut kernels, at three different percentage contents of oleic acid are shown in Fig 1. The peaks and valleys in the NIR region represent absorption of electromagnetic energy. Strong NIR absorption bands near 1400–1440 nm and 1900–1950 nm are often used for quantitative analysis of water content in foods. The NIR spectra consisted of peaks at 1722, 1735, 1757, 1768, 1787, 2127 and 2144 nm for saturated and trans-unsaturated fatty acids (Fig. 2). The peaks around 1660 nm and 2145 nm are due to cis –unsaturation. All these peaks appeared more clearly than in primary spectra given in Fig. 1.
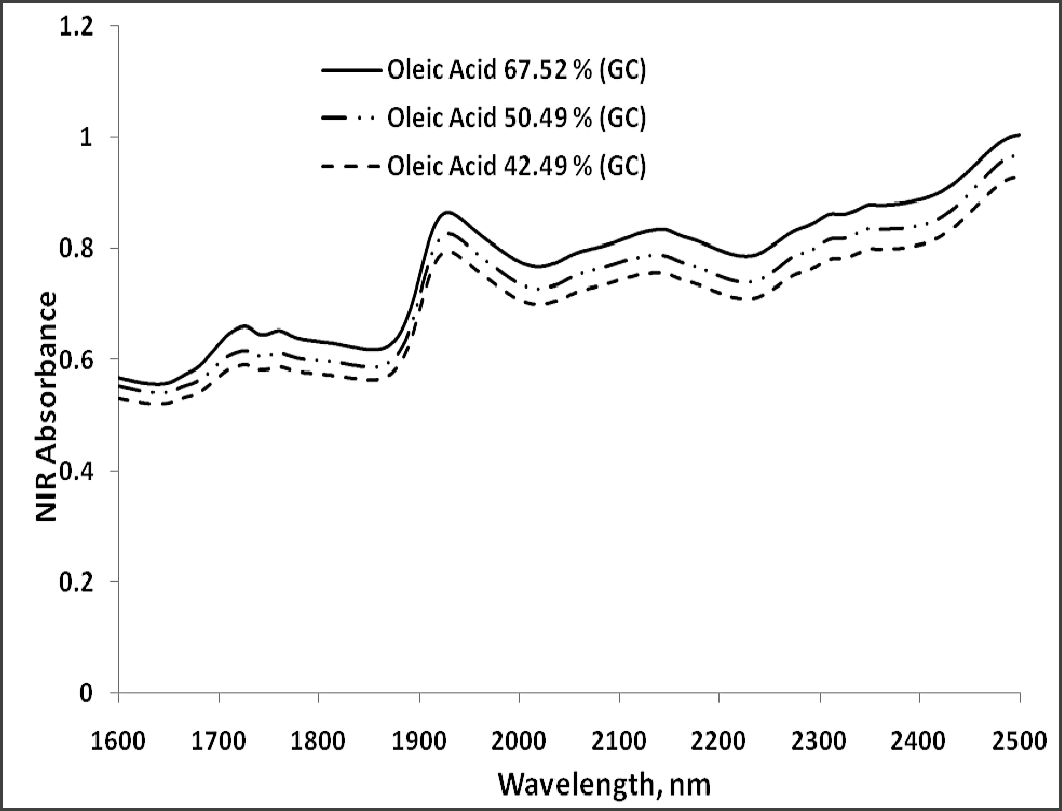
Primary absorption spectrum of peanut kernels varying with oleic acid percentage.
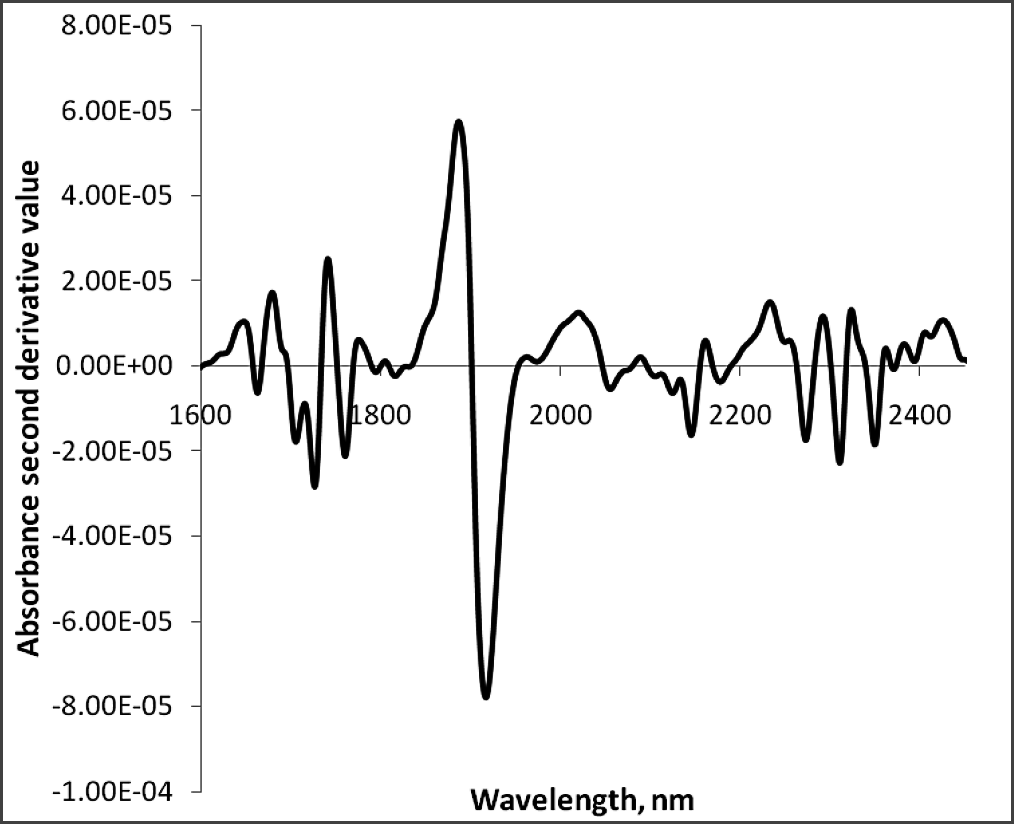
Absorption derivative spectra of peanut kernel.
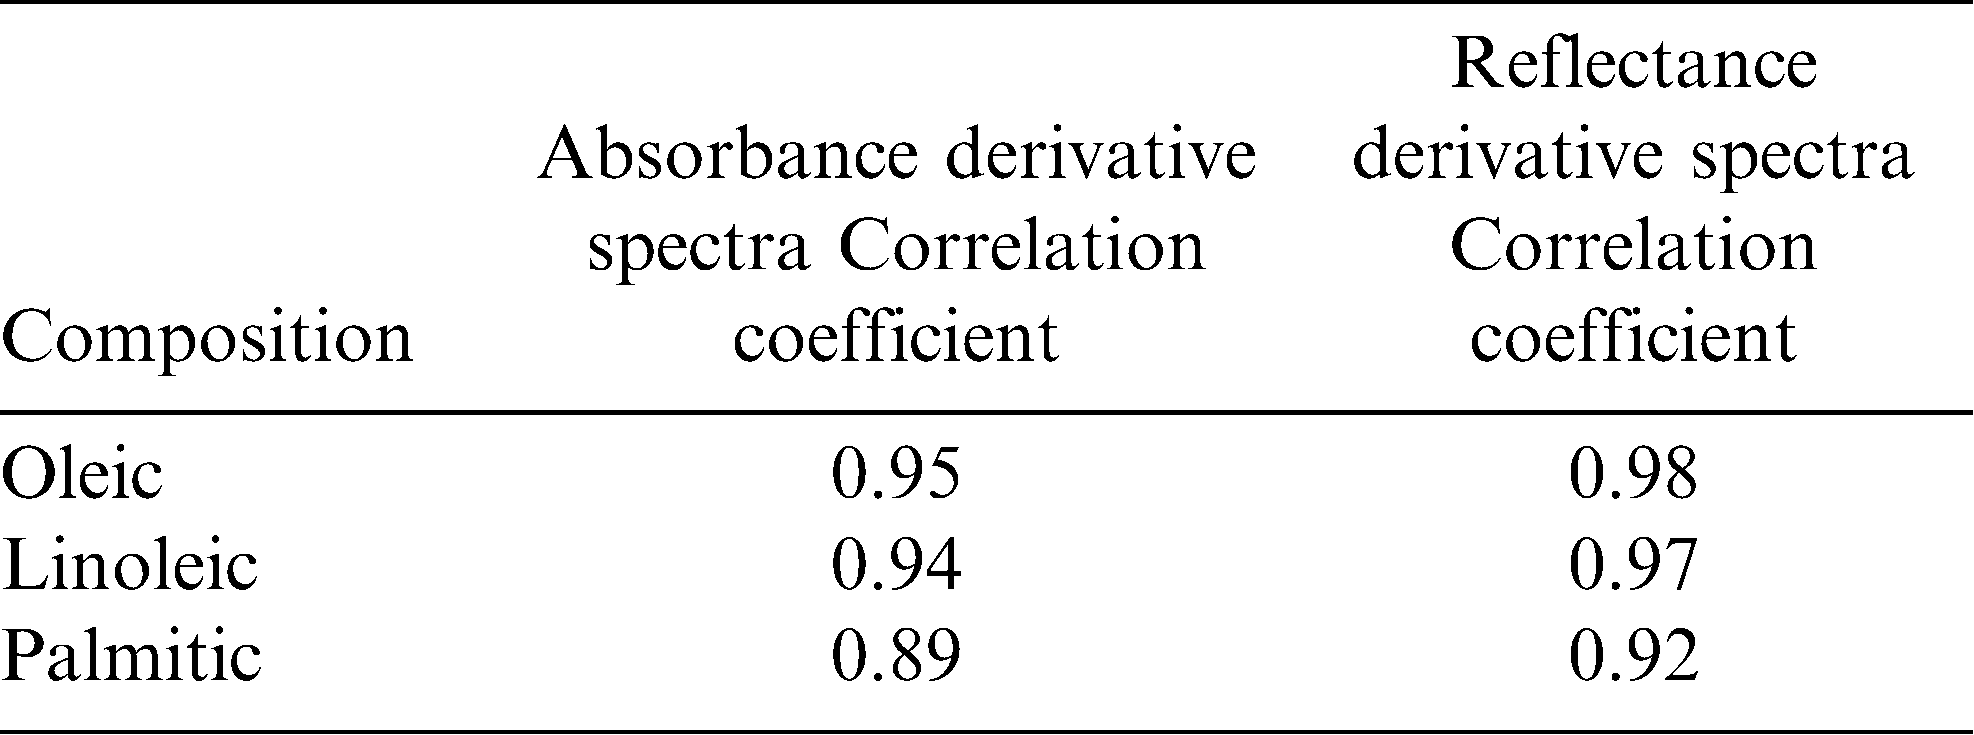
The regression coefficients of the calibration model were developed for the fatty acids, oleic acid (Fig.3a), linoleic acid (Fig.3b) and palmitic acid (Fig. 3c) using absorbance and reflectance derivative data and PLS regression. Wavelengths corresponding to many of the peaks appearing in this figure are related to fatty acid composition of peanuts. The peaks ranging between 1600–1800 nm and 2100–2400 nm contributed significantly to the regression coefficients of the calibration equation developed using the reference values of fatty acids obtained from GC methods. Table 2 shows the fatty acid concentration determined using GC and also the values predicted using NIR through the PLS calibration equation. Table 3 shows the GC measures as well as the NIR predicted values through the cross validation of the model. The correlation coefficient obtained between the GC- measured and NIR- predicted fatty acid concentrations in cross validation are given in Table 4. Both NIR absorption and reflection models gave a correlation coefficient of 0.94 (94%) or better for oleic and linoleic acids. Palmitic acid gave a correlation coefficient of 0.89 (89%) with the absorption model and 0.92 (92%) with the reflection model. Fitness measures of PLS calibration regression curves are given in Table 5. R2 obtained in this table is 0.99 for all the models and fatty acid concentrations. The PLS calibration curve fitted well with the fatty acid concentration percentages and the NIR wavelengths selected for the prediction model development. Also, their root mean square error of calibration (RMSEC) values, were low. Based on guidelines for interpretation of R2, outlined by Williams and Norris (2001) and Williams (2001), NIR calibration equations for fatty acids were found suitable for quality assurance applications. A previous study by Pazdernik et al., (1997), on the applicability of NIRS for fatty acid composition determination in soybeans, resulted in R2 values (for validation samples) of 0.18 (palmitic), 0.38 (oleic), and 0.52 (linoleic) for whole-seeds.
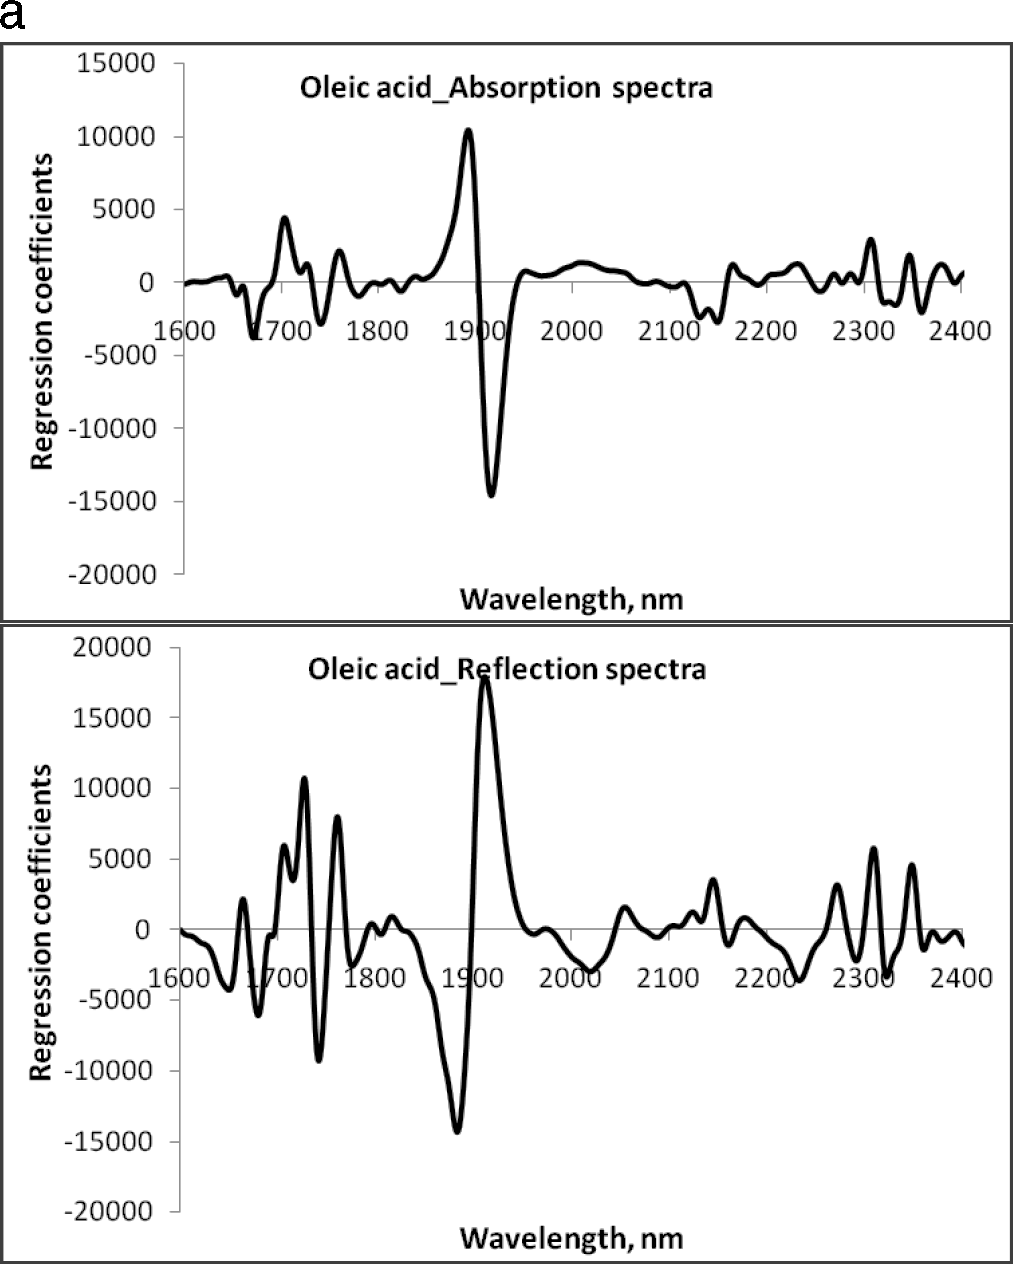
Absorption and reflection derivative regression coefficients of oleic acid.
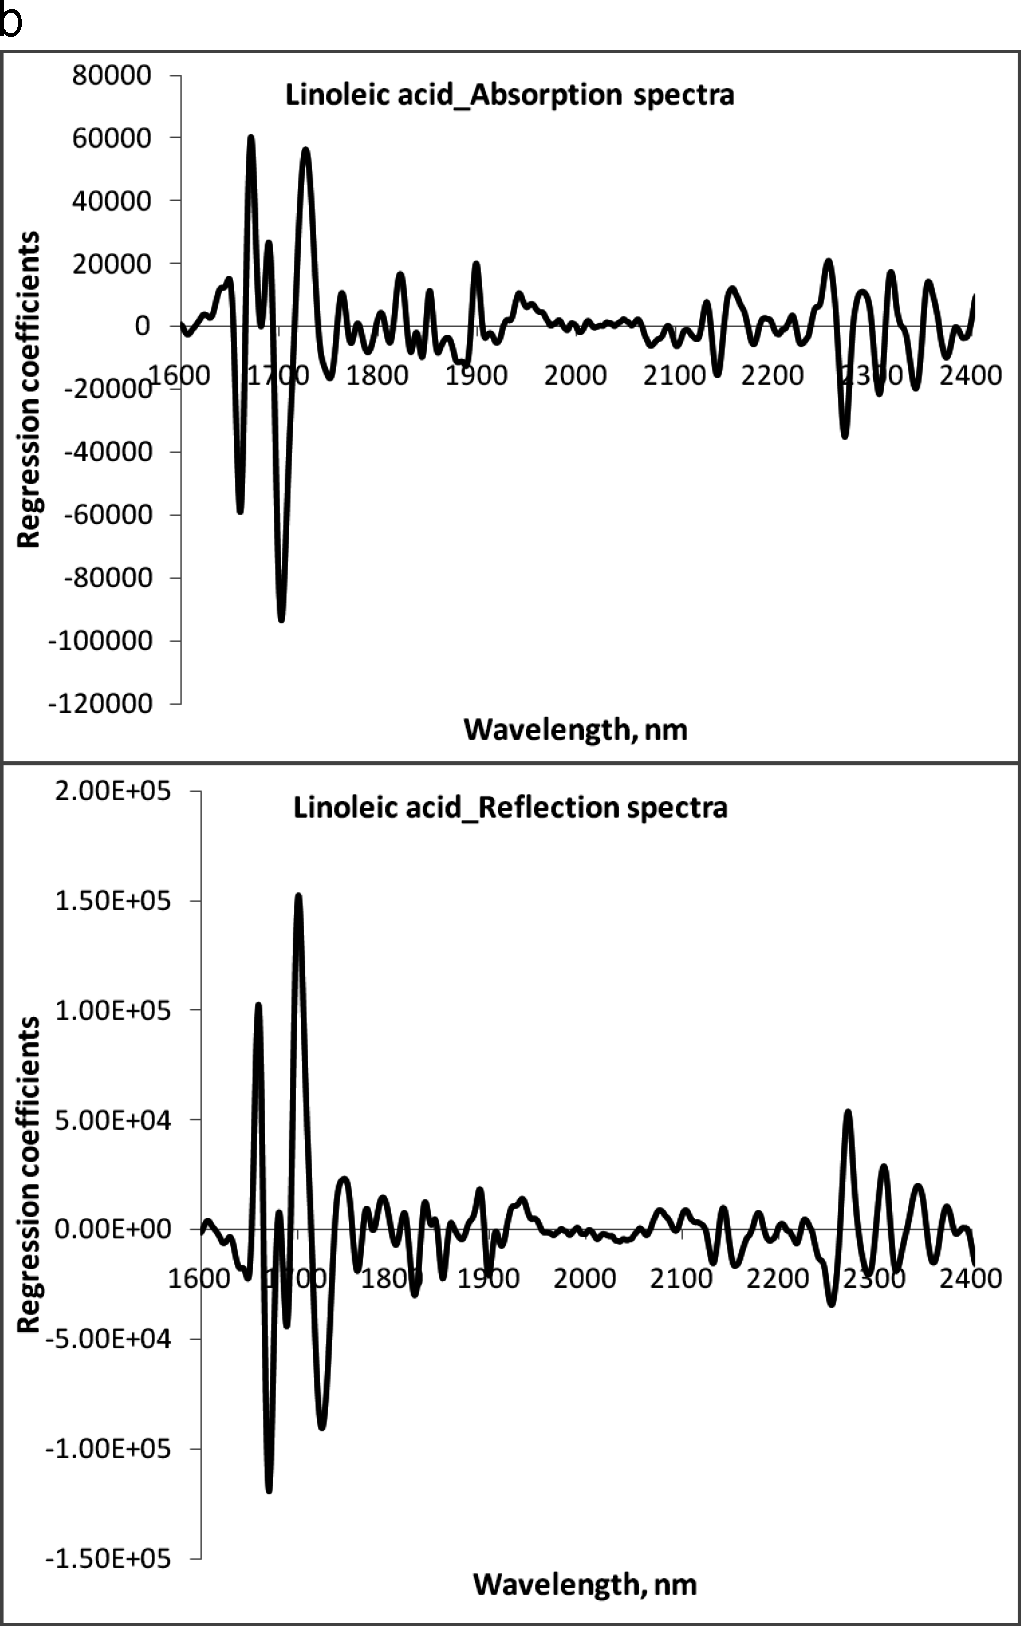
Absorption and reflection derivative regression coefficients of linoleic acid.
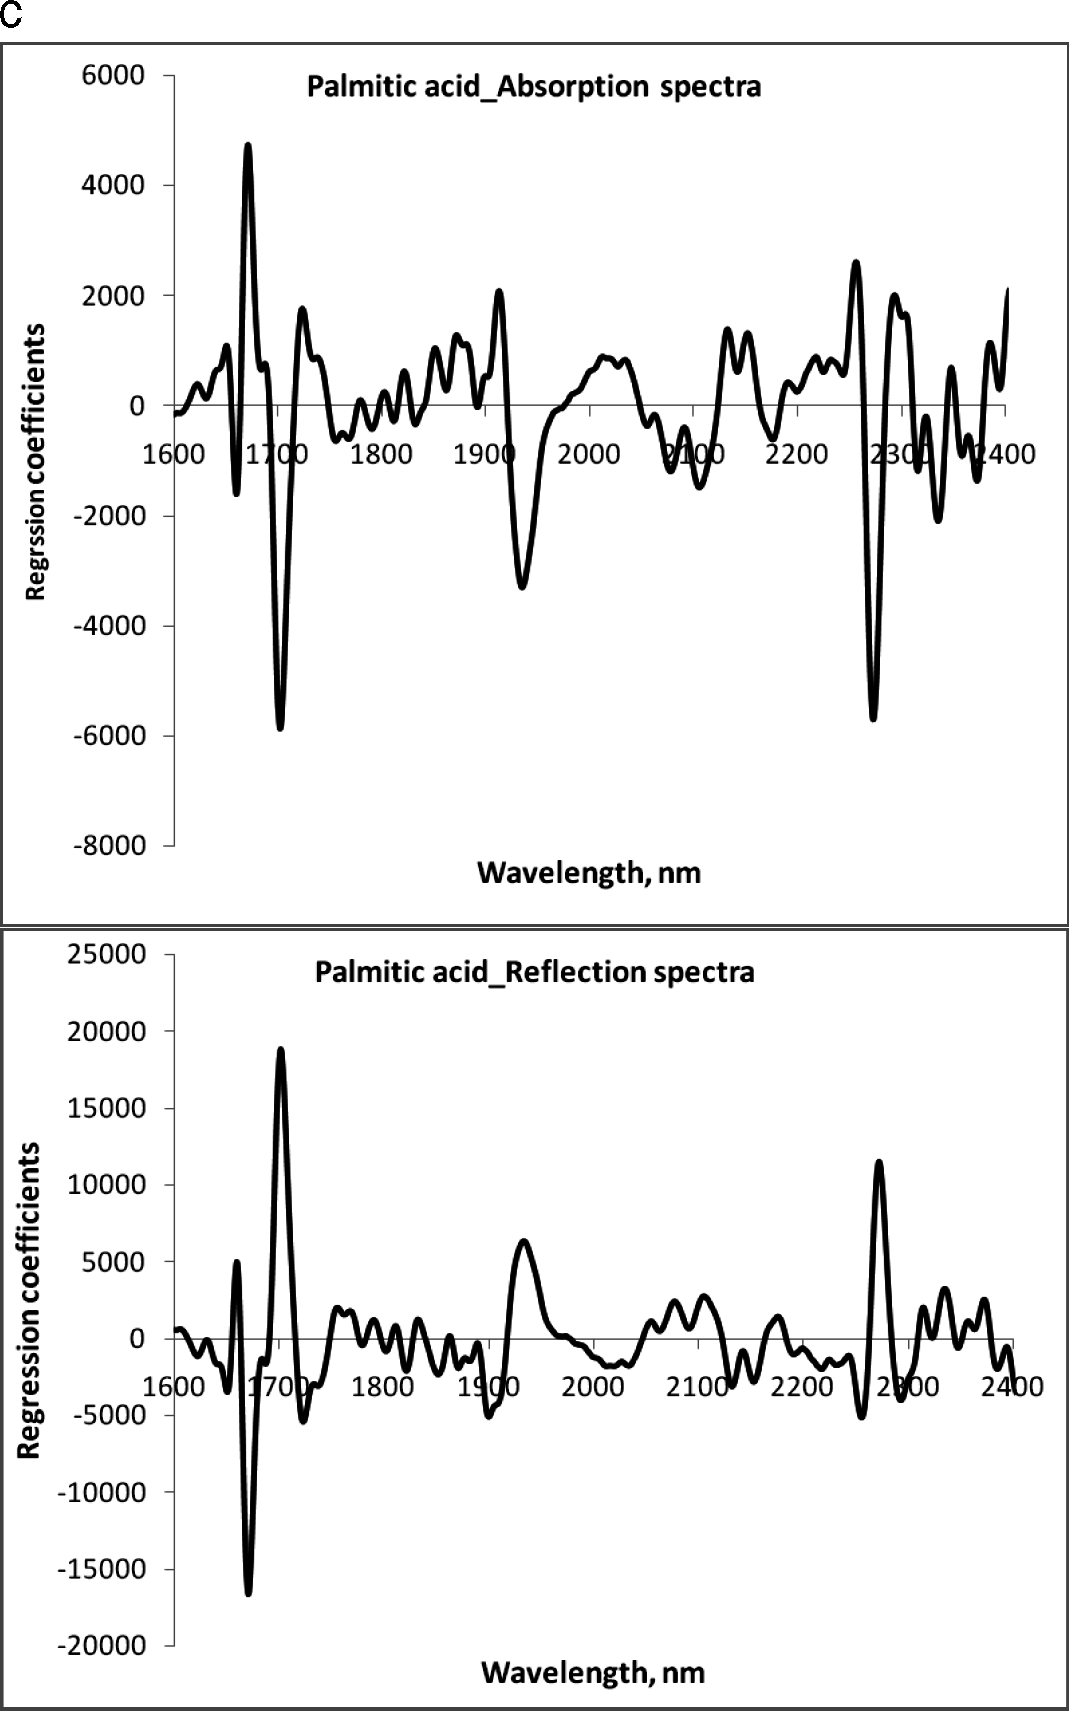
Absorption and reflection derivative regression coefficients of palmitic acid.
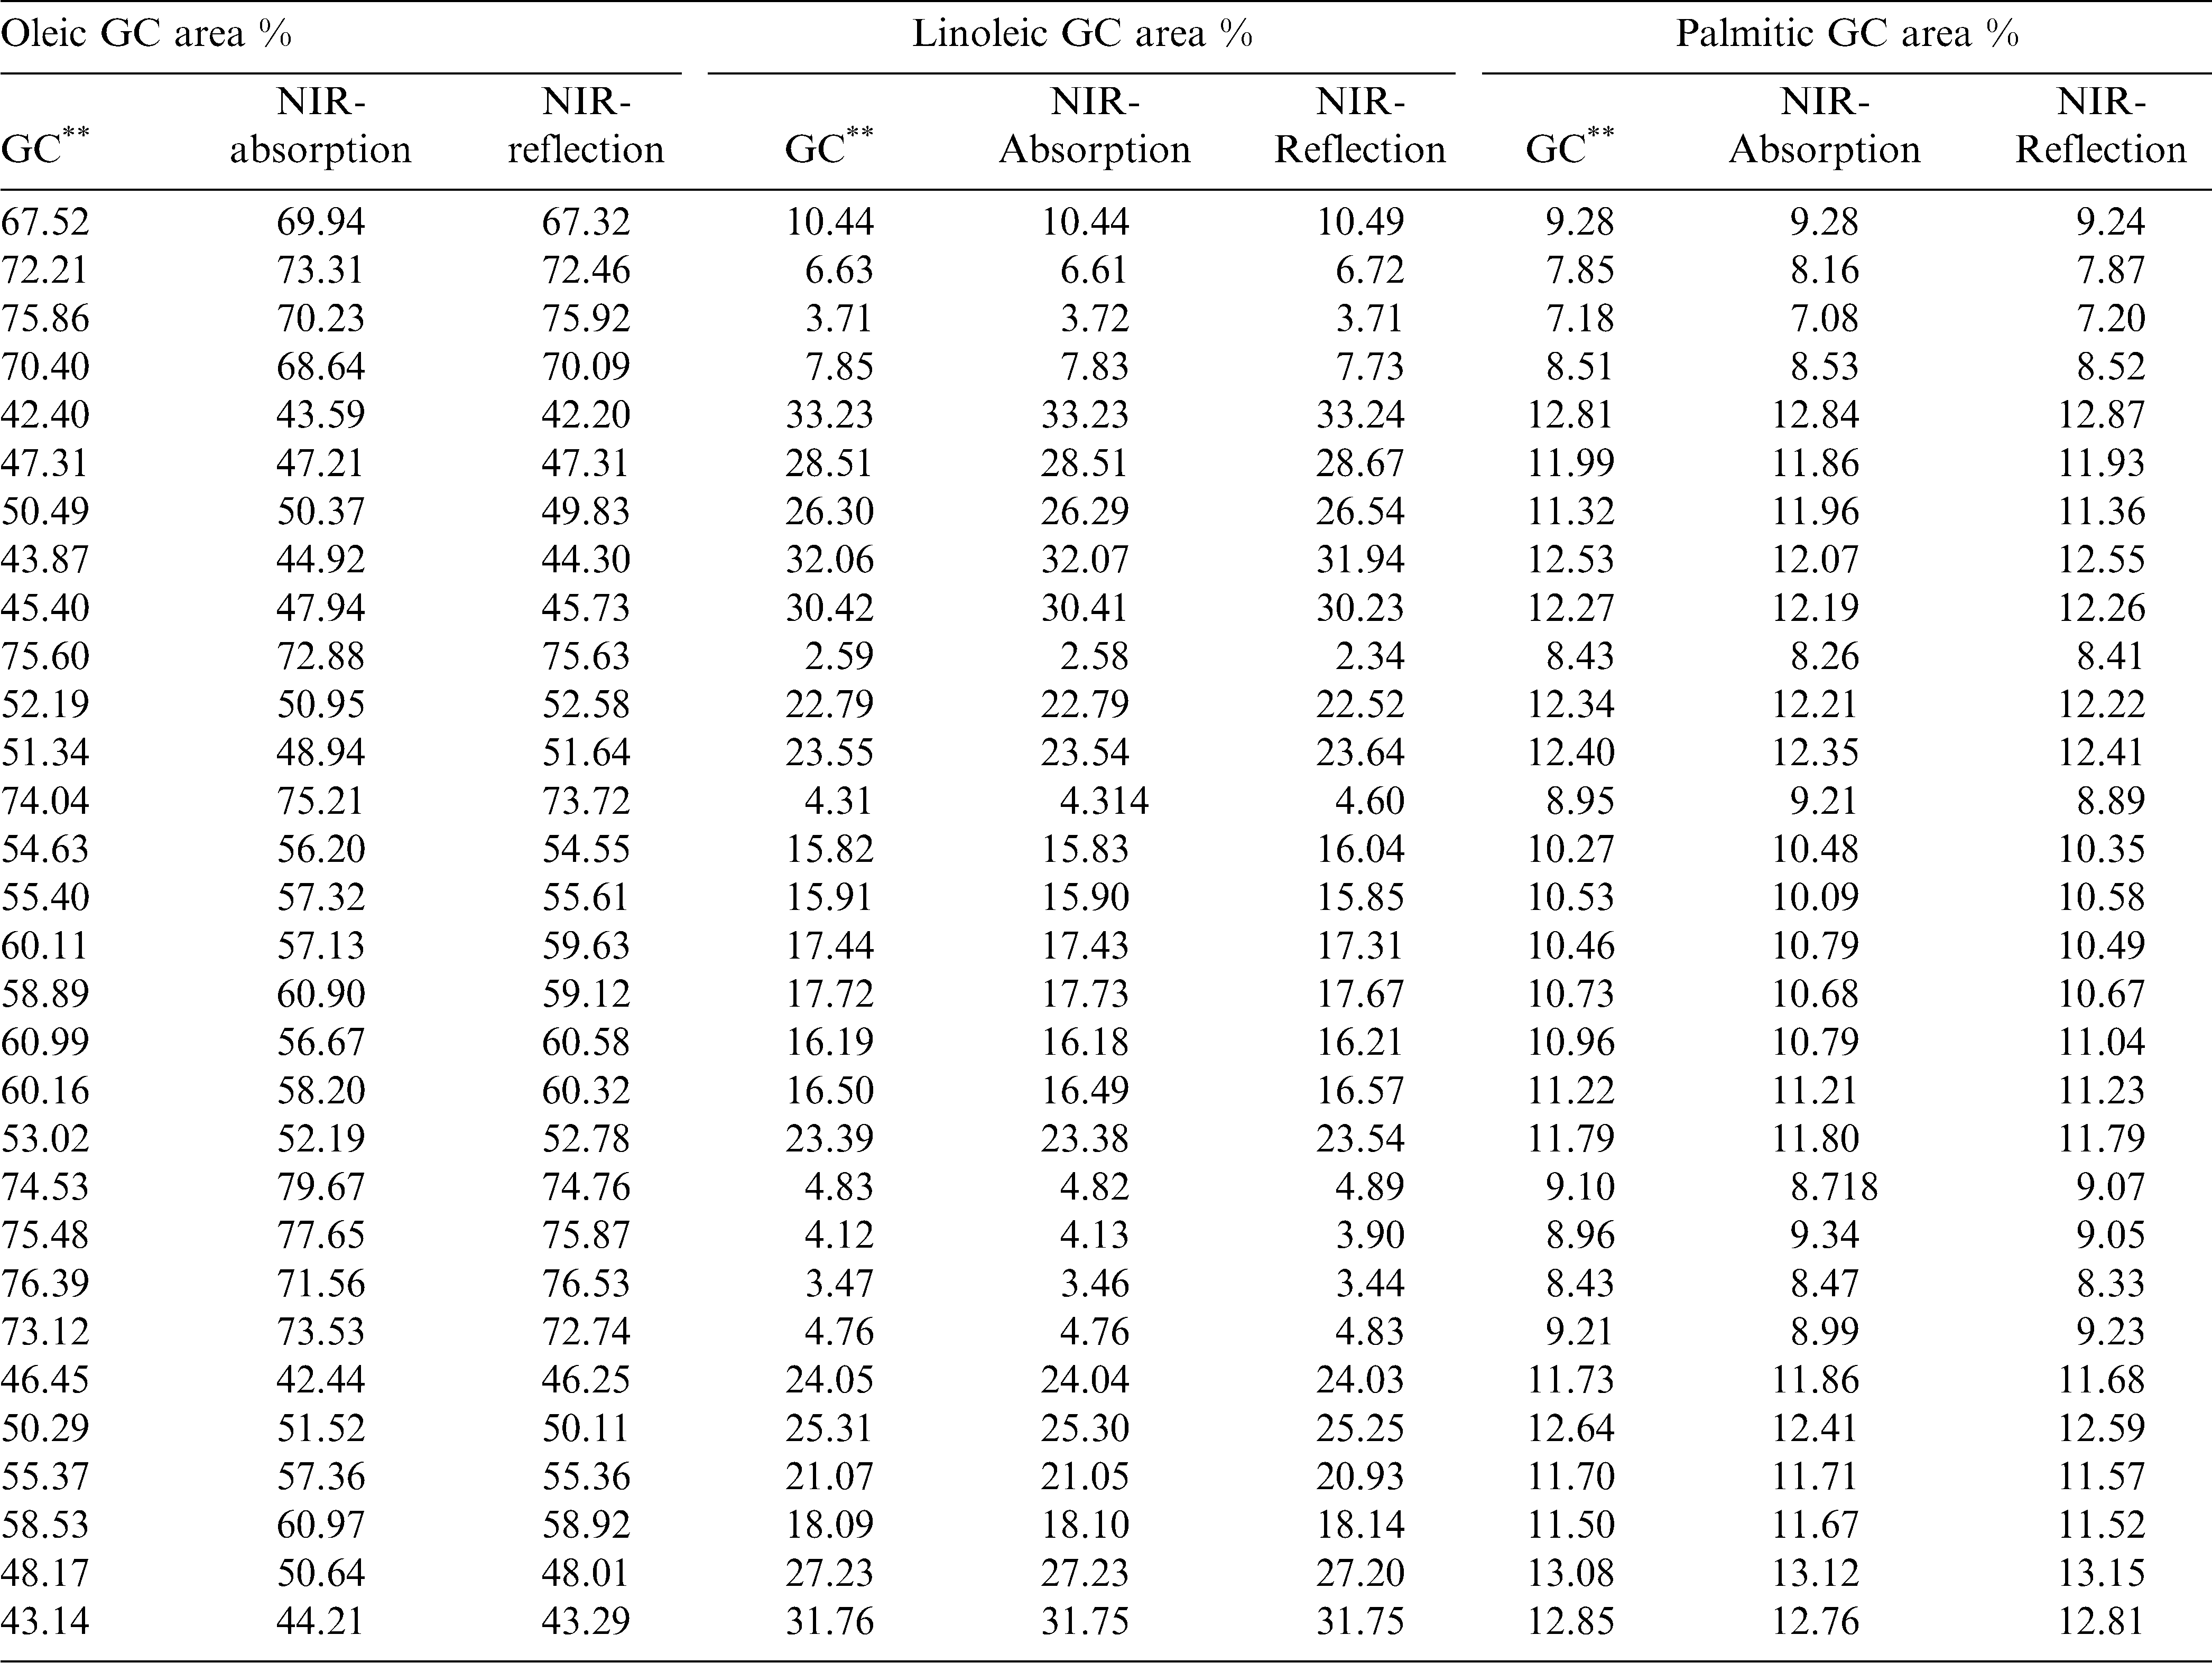
Fatty acid composition in different peanut cultivars determined using gas chromatography method and near infrared spectroscopy predicted values in calibration model.
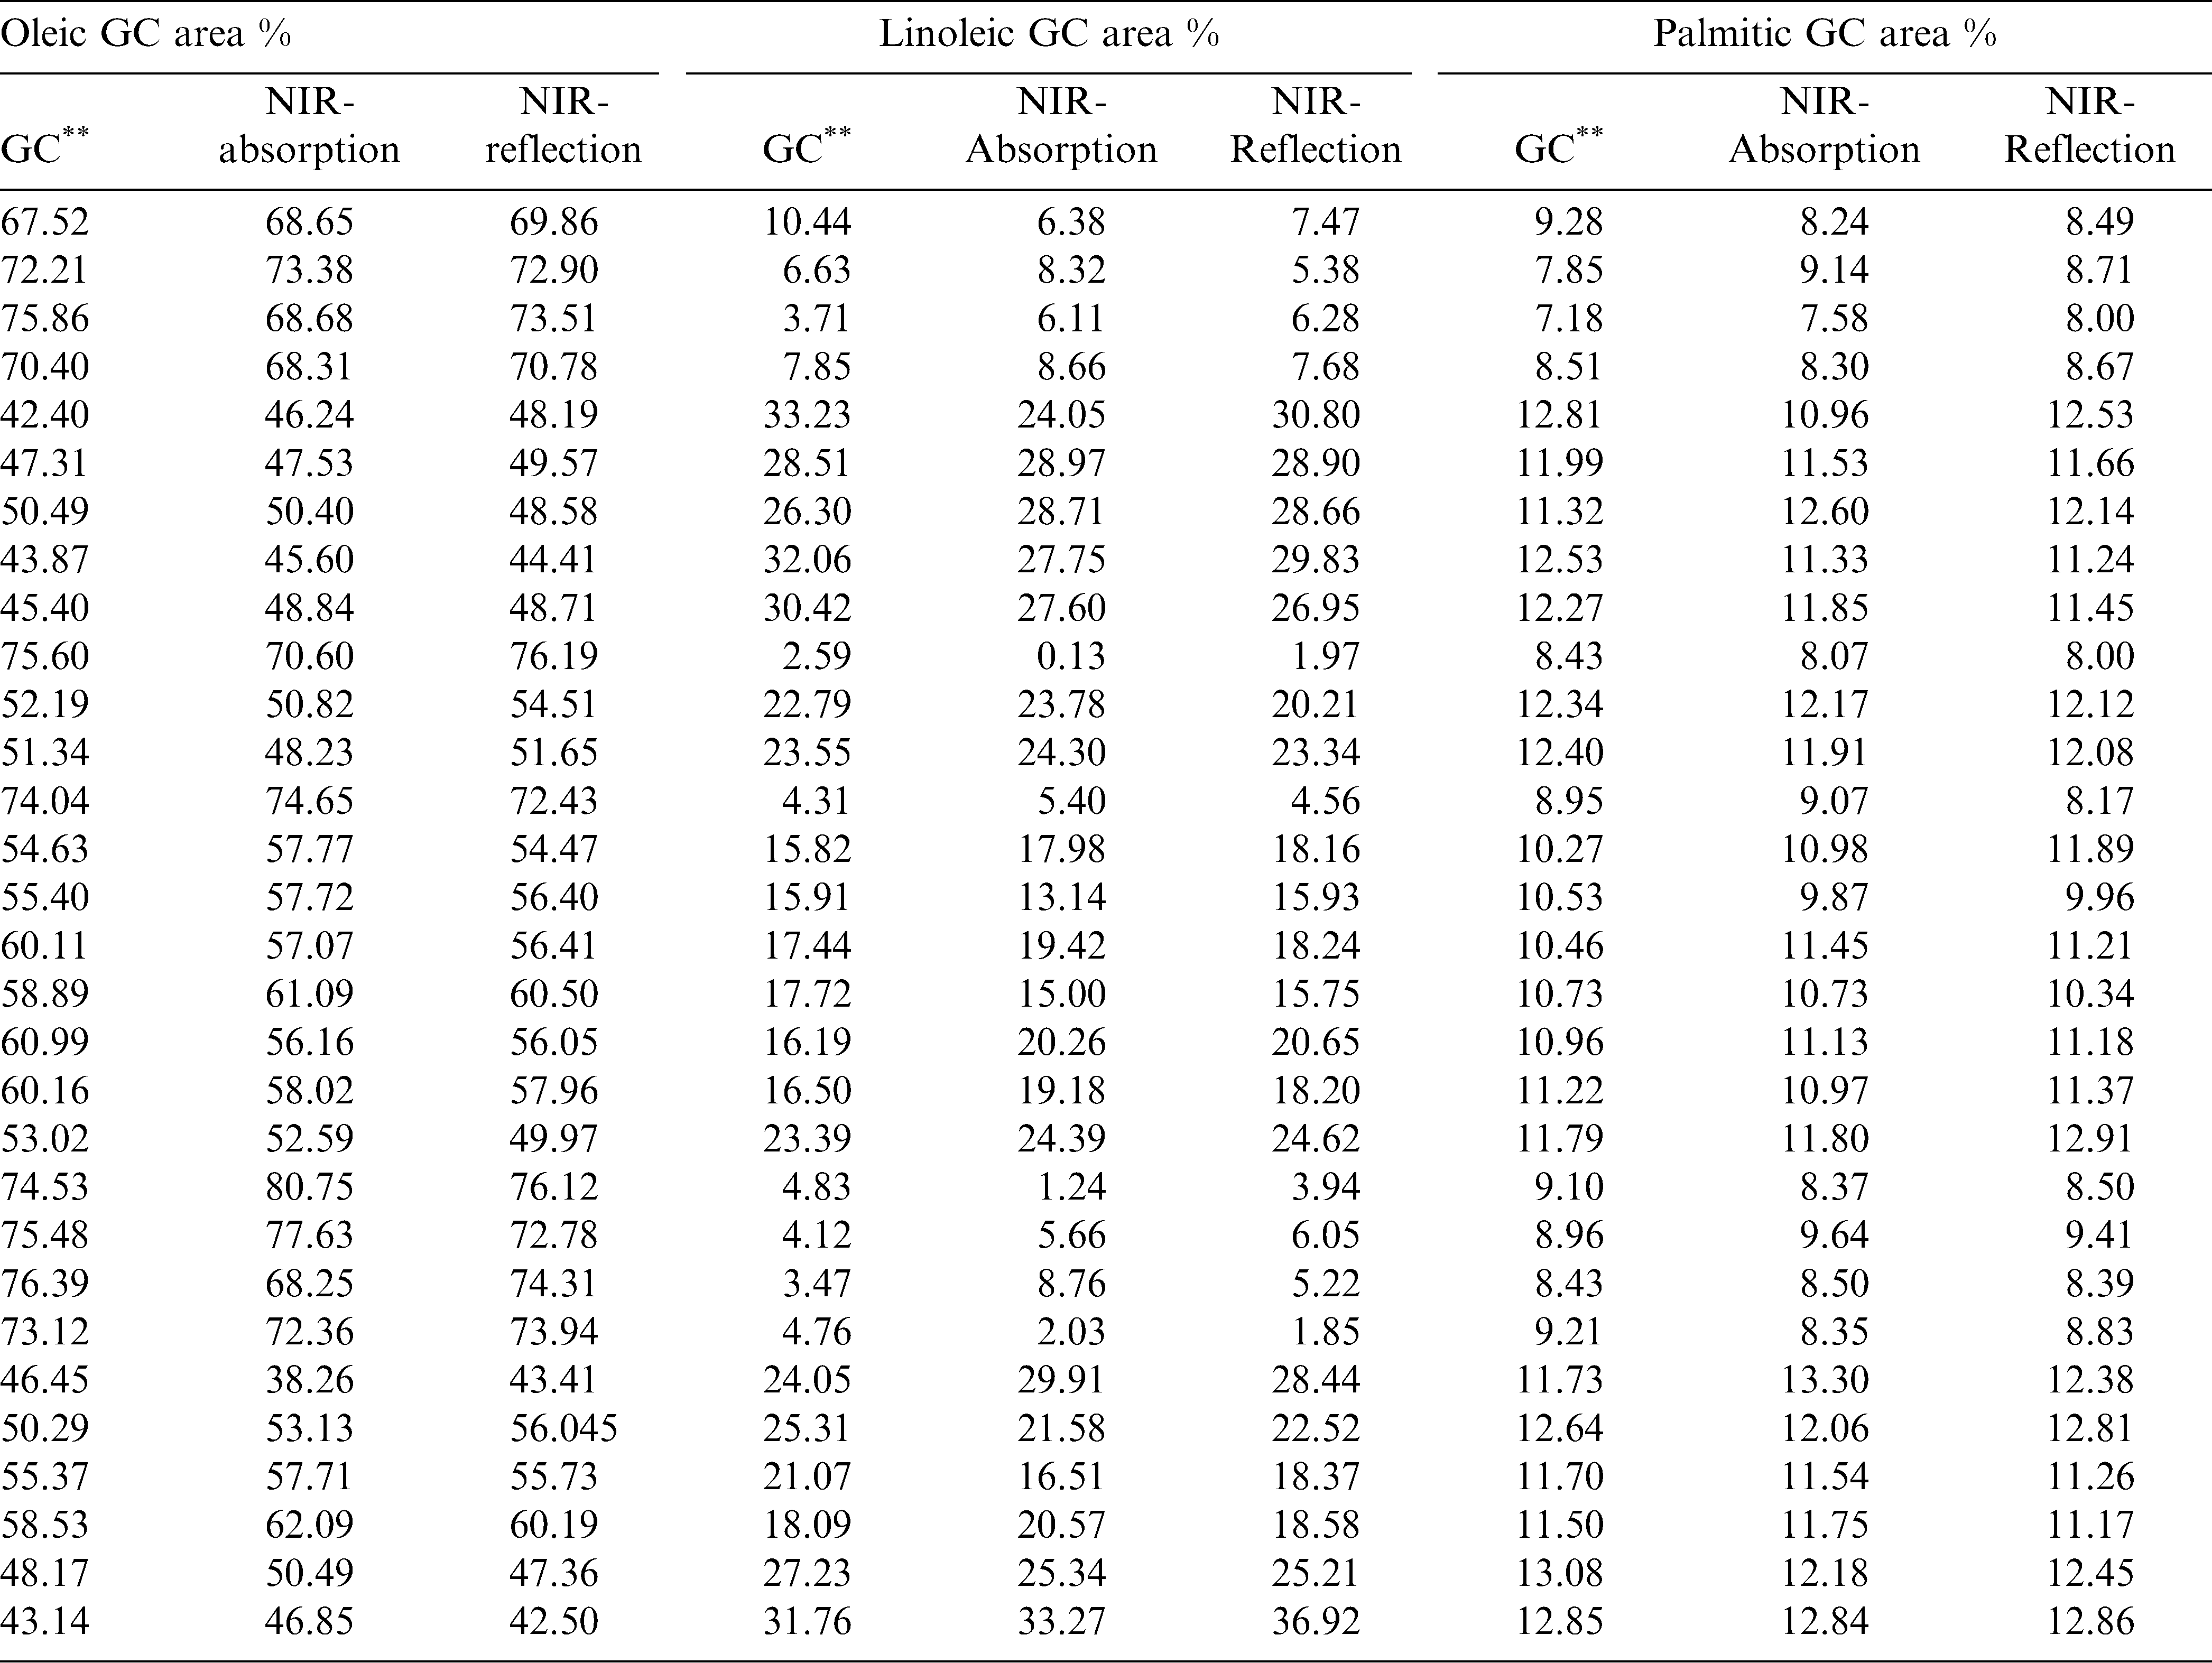
Fatty acid composition in different peanut cultivars determined using gas chromatography method and near infrared spectroscopy predicted values in cross validation.
Correlation coefficient obtained for gas chromatography measured and near infrared spectroscopy predicted fatty acid concentrations.
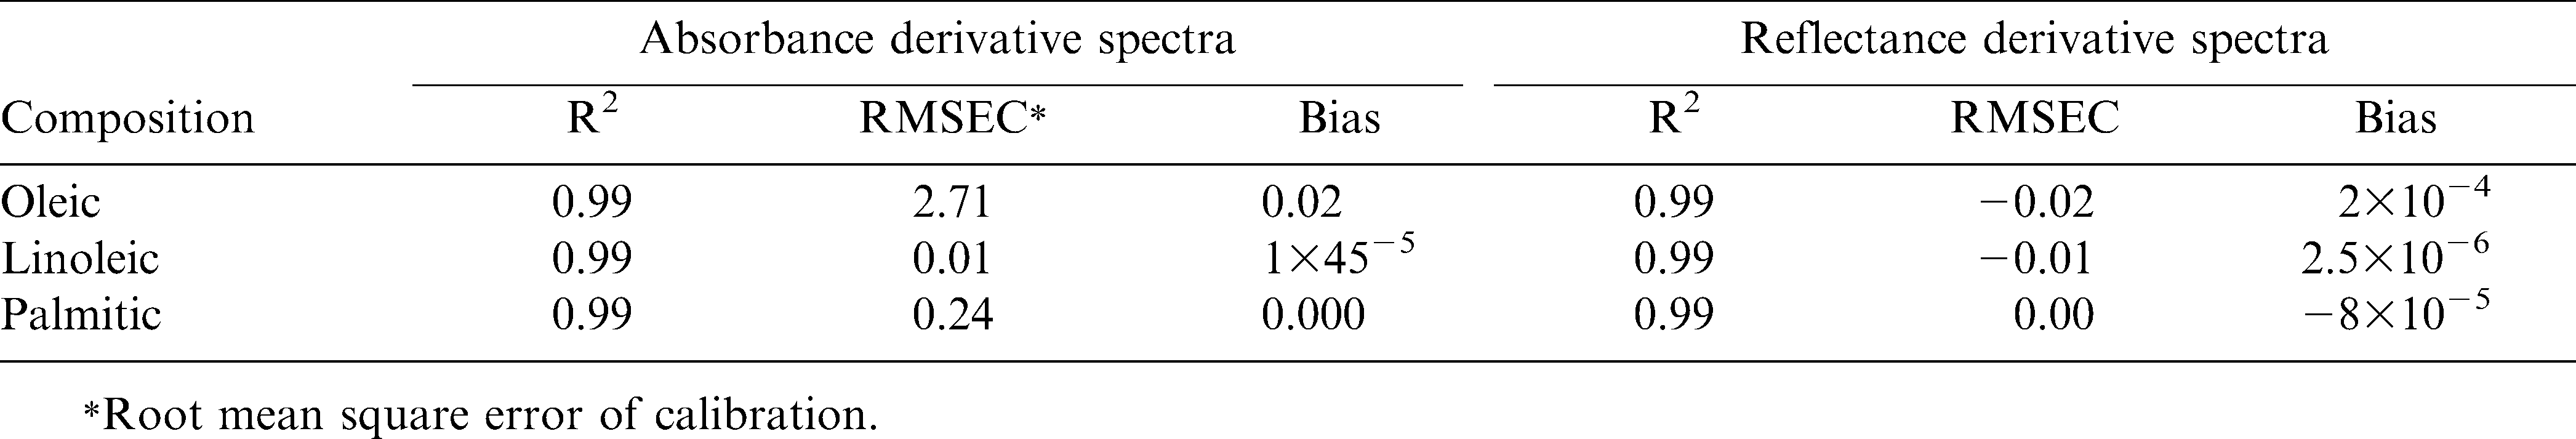
Fitness measures of calibration model for peanut fatty acids.
Table 6 shows the fitness measures of the cross validation of the fatty acid predictions using the PLS calibration model. Relative percent deviation (RPD) values (standard deviation divided by Standard Error of Prediction) obtained for the fatty acid prediction through the absorption and reflection models are greater than 2. The reflection model gave the RPD values for linoleic and palmitic acids greater than 3 and thus they would be useful for estimating the respective fatty acid concentrations in peanut kernels. Because higher values indicate a stronger calibration model to predict the composition accurately in the unknown samples ( Sundaram et al., 2010a; Fearn, 2002; Williams, 2001). The same model gave an RPD value close to 3 for oleic acid, making it suitable for predicting oleic acid in peanuts. However, the absorption models did not perform as well as the reflectance model. The performance may improved by increasing the sample size and introducing more samples with very high and low values of fatty acids into corresponding calibration data sets, predictive ability of NIRS for these constituents may be improved. Therefore, for this analysis, it could be concluded that reflectance derivative model is the best model for fatty acid concentration prediction.
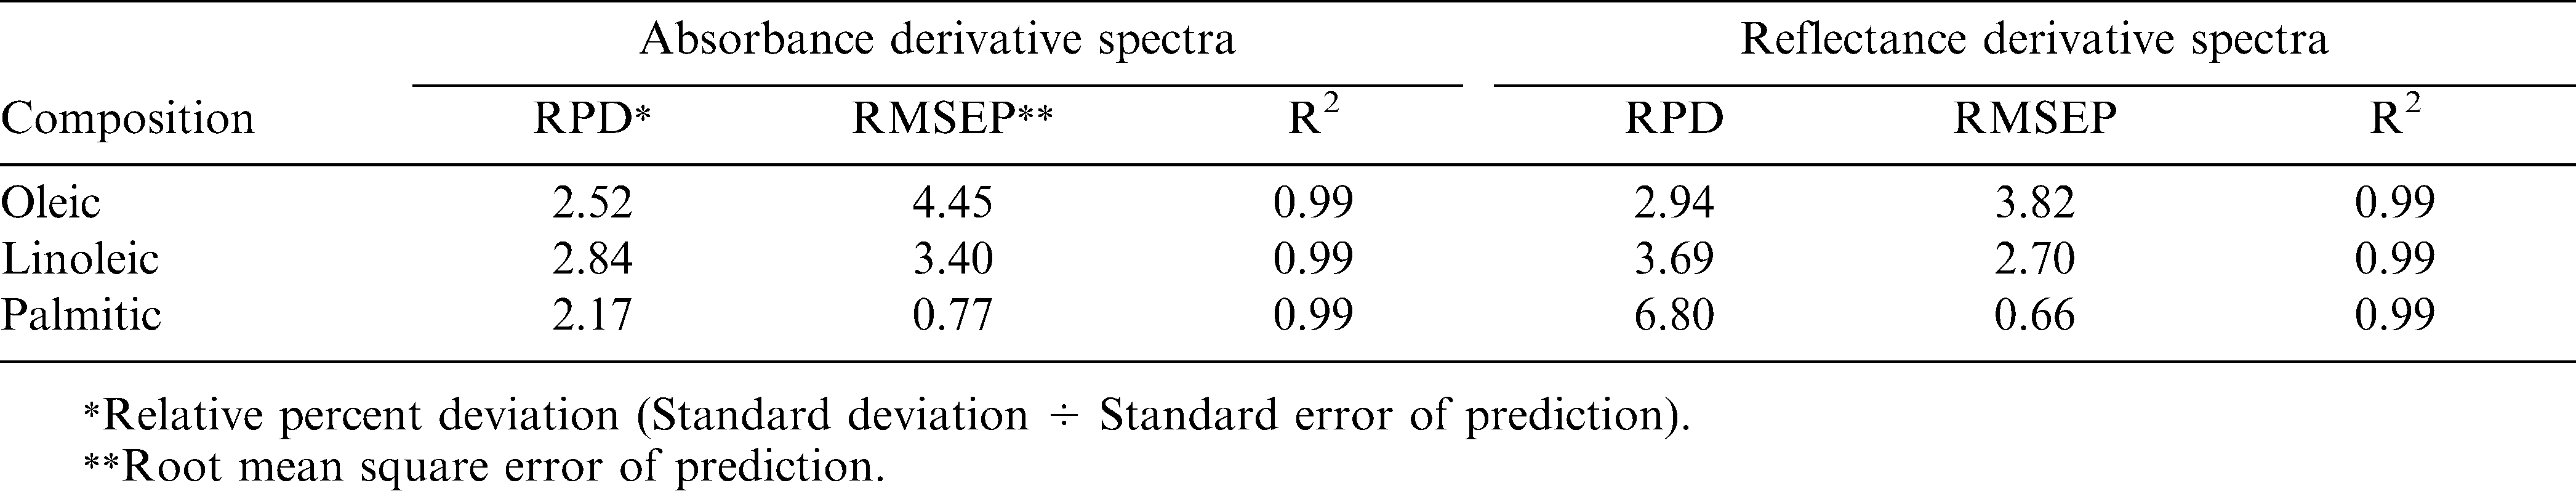
Fitness measures of cross validation of peanut fatty acids.
Summary and Conclusion
NIRS could be a useful tool for the nondestructive analysis of fatty acid concentration of peanut seeds (kernels). An NIR reflectance derivative model was found to be the best model for the prediction of all three fatty acids viz., oleic, linoleic and palmitic based on the RPD values and correlation coefficients. NIR measurements are procedurally very simple, considerably reducing the time required for measurements to approximately 5 to 10 minutes, compared to standard analytical procedures such as gas chromatography which typically requires 2 to 4 hours. The use of NIR spectroscopy as described in this paper would result in significant savings in time and labor and is suitable for use in peanut breeding program to select and classify the seeds based on their fatty acid concentrations. Further improvement in the analysis of NIR data may make it possible to estimate the fatty acid profile with sufficient accuracy to improve quality control of peanut samples for peanut breeders.
Literature Cited
Bhatty R.S 1991 Measurement of oil in whole flaxseed by near-infrared reflectance. Spectroscopy J Amer. Oil Chem. Soc. 68 : 34 – 38 .
Daun J.K Clear K.M and Williams P 1994 Comparison of three whole seed near infrared analyzers for measuring quality components of canola seed J Amer. Oil Chem. Soc. 71 : 1063 – 1068 .
Fearn T 2002 NIR News , 13 : 12 .
Holman R.T and Edmondson P.R 1956 Near-infrared spectra of fatty acids and some related substances Anal. Chem. 28 : 1533 – 1538 .
Kaffka K.J Norris K.H Perédi J and Balogh A 1982 Attempts to determine oil, protein, water and fiber content in sunflower seeds by the NIR technique Acta Alimentaria 11 : 253 – 269 .
Misra B.J Mathur R.S and Bhatt D.M 2000 Near-infrared transmittance spectroscopy: a potential tool for non-destructive determination of oil content in groundnuts J. Sci. Food Agric. 80 : 237 – 240 .
Murray I 1987 NIR spectra of homologous series of organic compounds 13 – 28 in: NIR/NIT Spectroscopy , Hollo J et al (eds.) Akademiai Kiado , Budapest, Hungary .
Nimaiyar S Paulsen M.R and Nelson R.L 2004 Rapid analysis of fatty acids in soybeans using FTNIR ASABE Paper No.046118. St. Joseph, Mich.: ASABE 15 pp.
Norris K.H 1964 Reports on design and development of a new moisture meter Agri. Eng. 45 ( 7 ): 370 – 372 .
Norris K.H and Hart J.R 1965 Principles and Methods of Measuring Moisture in Liquids and Solids. 19–25. Vol. 4 A. Wexler (ed) Reinhold, New York .
Panforda J.A and DeManb J.M 1990 Determination of oil content of seeds by NIR: Influence of fatty acid Composition on wavelength selection J Amer. Oil Chem. Soc. 67 : 473 – 482 .
Pazdernik D.L Killam A.S and Orf J.H 1997 Analysis of amino and fatty acid composition in soybean seed, using near infrared reflectance spectroscopy Agron. J. 89 : 679 – 685 .
Pérez-Vich B Velasco L and Fernández-Martínez J.M 1998 Determination of seed oil content and fatty acid composition in sunflower through the analysis of intact seeds, husked seeds, meal and oil by near-infrared reflectance spectroscopy J Amer. Oil Chem. Soc. 75 : 547 – 555 .
Robertson J.A and Barton F.E 1984 Oil and water analysis of sunflower seed by near infrared reflectance spectroscopy J Amer. Oil Chem. Soc. 61 ( 3 ): 543 – 547 .
Rosenthal R.D 1973 The Grain Quality Analyzer , 3rd Pacific Northwest Grain Inspection Workshop , Portland, OR .
Sato T 2002 New estimation method for fatty acid composition in oil using near infrared spectroscopy Biosci.Biotechnol.Biochem. 66 : 2453 – 2458 .
Sato T Takahata Y Noda T Tanagisawa T Morishita T and Sakai S 1995 Nondestructive determination of fatty acid composition of husked sunflower (Helianthus annuus L.) seeds by near-infrared spectroscopy J Amer. Oil Chem. Soc. 72 : 1177 – 1183 .
Sundaram J Kandala C.V Ronald H.A Butts C.L and Windham W.R 2010 Determination of in-shell peanuts moisture, oil and fatty acids composition using near infrared reflectance spectroscopy J Amer. Oil Chem. Soc. 87 ( 10 ): 1103 – 1114 .
Sundaram J Kandala C.V Butts C.L and Windham W.R 2010 Application of NIR reflectance spectroscopy for the determination of moisture content of in-shell peanuts: A nondestructive method Transaction of ASABE. 53 ( 1 ): 183 – 189 .
Tillman B.L Gorbet D.W and Person G 2006 Predicting oleic and linoleic acid content of single peanut seeds using near-infrared reflectance spectroscopy Crop Sci. 46 : 2121 – 2126 .
Tkachuk R Mellish V.J Daun J.K and Macri L.J 1988 Determination of chlorophyll in ground rapeseed using a modified near infrared reflectance spectrophotometer J Amer. Oil Chem. Soc. 65 ( 3 ): 381 – 385 .
USDA 2000 , AMS farmers stock peanut inspection instructions Updated 2000 , Washington D.C., USA .
Velasco L and Becker H.C 1998 Estimating the fatty acid composition of the oil in intact seed rapeseed (Brassica napus L.) by near infrared reflectance spectroscopy Euphytica 101 : 221 – 230 .
Williams P.C 2001 Implementation of near-infrared technology, In: American Association of Cereal Chemist , Williams P.C and Norris K.H (eds.) St. Paul, MN, USA 145 pp.
Williams P.C and Norris K 2001 Near-Infrared Technology in the Agricultural and Food Industries, 2nd edn ., AACC Inc. , St. Paul, Minnesota .
Windham W.R Kandala C.V Sundaram J and Russell N.C 2010 Determination of peanut pod maturity by near infrared reflectance spectroscopy Transaction of ASABE 53 ( 2 ): 491 – 495 .
Notes
- Agricultural Engineer, USDA, ARS, Russell Research Center, Athens, GA. [^]
- Agricultural Engineer, Agricultural Engineer, Research Geneticist, and Research Chemist, respectively, USDA, ARS, National Peanut Research Laboratory, Dawson, GA 39842. [^] *Corresponding author email: jaya.sundaram@ars.usda.gov
- Mention of company or trade names is for the purpose of description only and does not imply endorsement by the U.S. Department of Agriculture. [^]
Author Affiliations
Disclaimer