

Introduction
One method of increasing and/or maintaining U.S. exports to foreign markets is through the use of export promotion programs. The U.S. Department of Agriculture (USDA) Foreign Agricultural Service (FAS) provides export promotion funding through two programs: the Foreign Market Development (FMD) and the Market Access Program (MAP). The goal of FMD is to create, expand, and maintain long-term export markets for U.S. agricultural products (FMD program, USDA 2007) while the purpose of MAP (formally known as the Marketing Promotion Program or MPP) is to help U.S. producers, exporters, private companies and other trade organizations finance promotional activities for U.S. agricultural products (MAP, USDA 2007).
In the case of U.S. peanut exports, the American Peanut Council (APC) in cooperation with the FAS administers the two export promotion programs for the peanut industry with the objective of increasing exports of all types of U.S. grown peanuts and peanut products. The export promotion program for peanuts began in 1978; however, it was only from the 1990s that FAS began export promotion activities for U.S. peanuts shipped to Mexico and Canada. These promotion expenditures on peanut exports to Mexico and Canada have increased substantially over time. The Mexican peanut export promotion program started in 1996 with only $7,300 and reached a peak of $422,100 in 2006. Promotion of peanut exports to Canada began in 1999 and has grown from $80,400 to $557,500 in 2006 (Fig. 1).
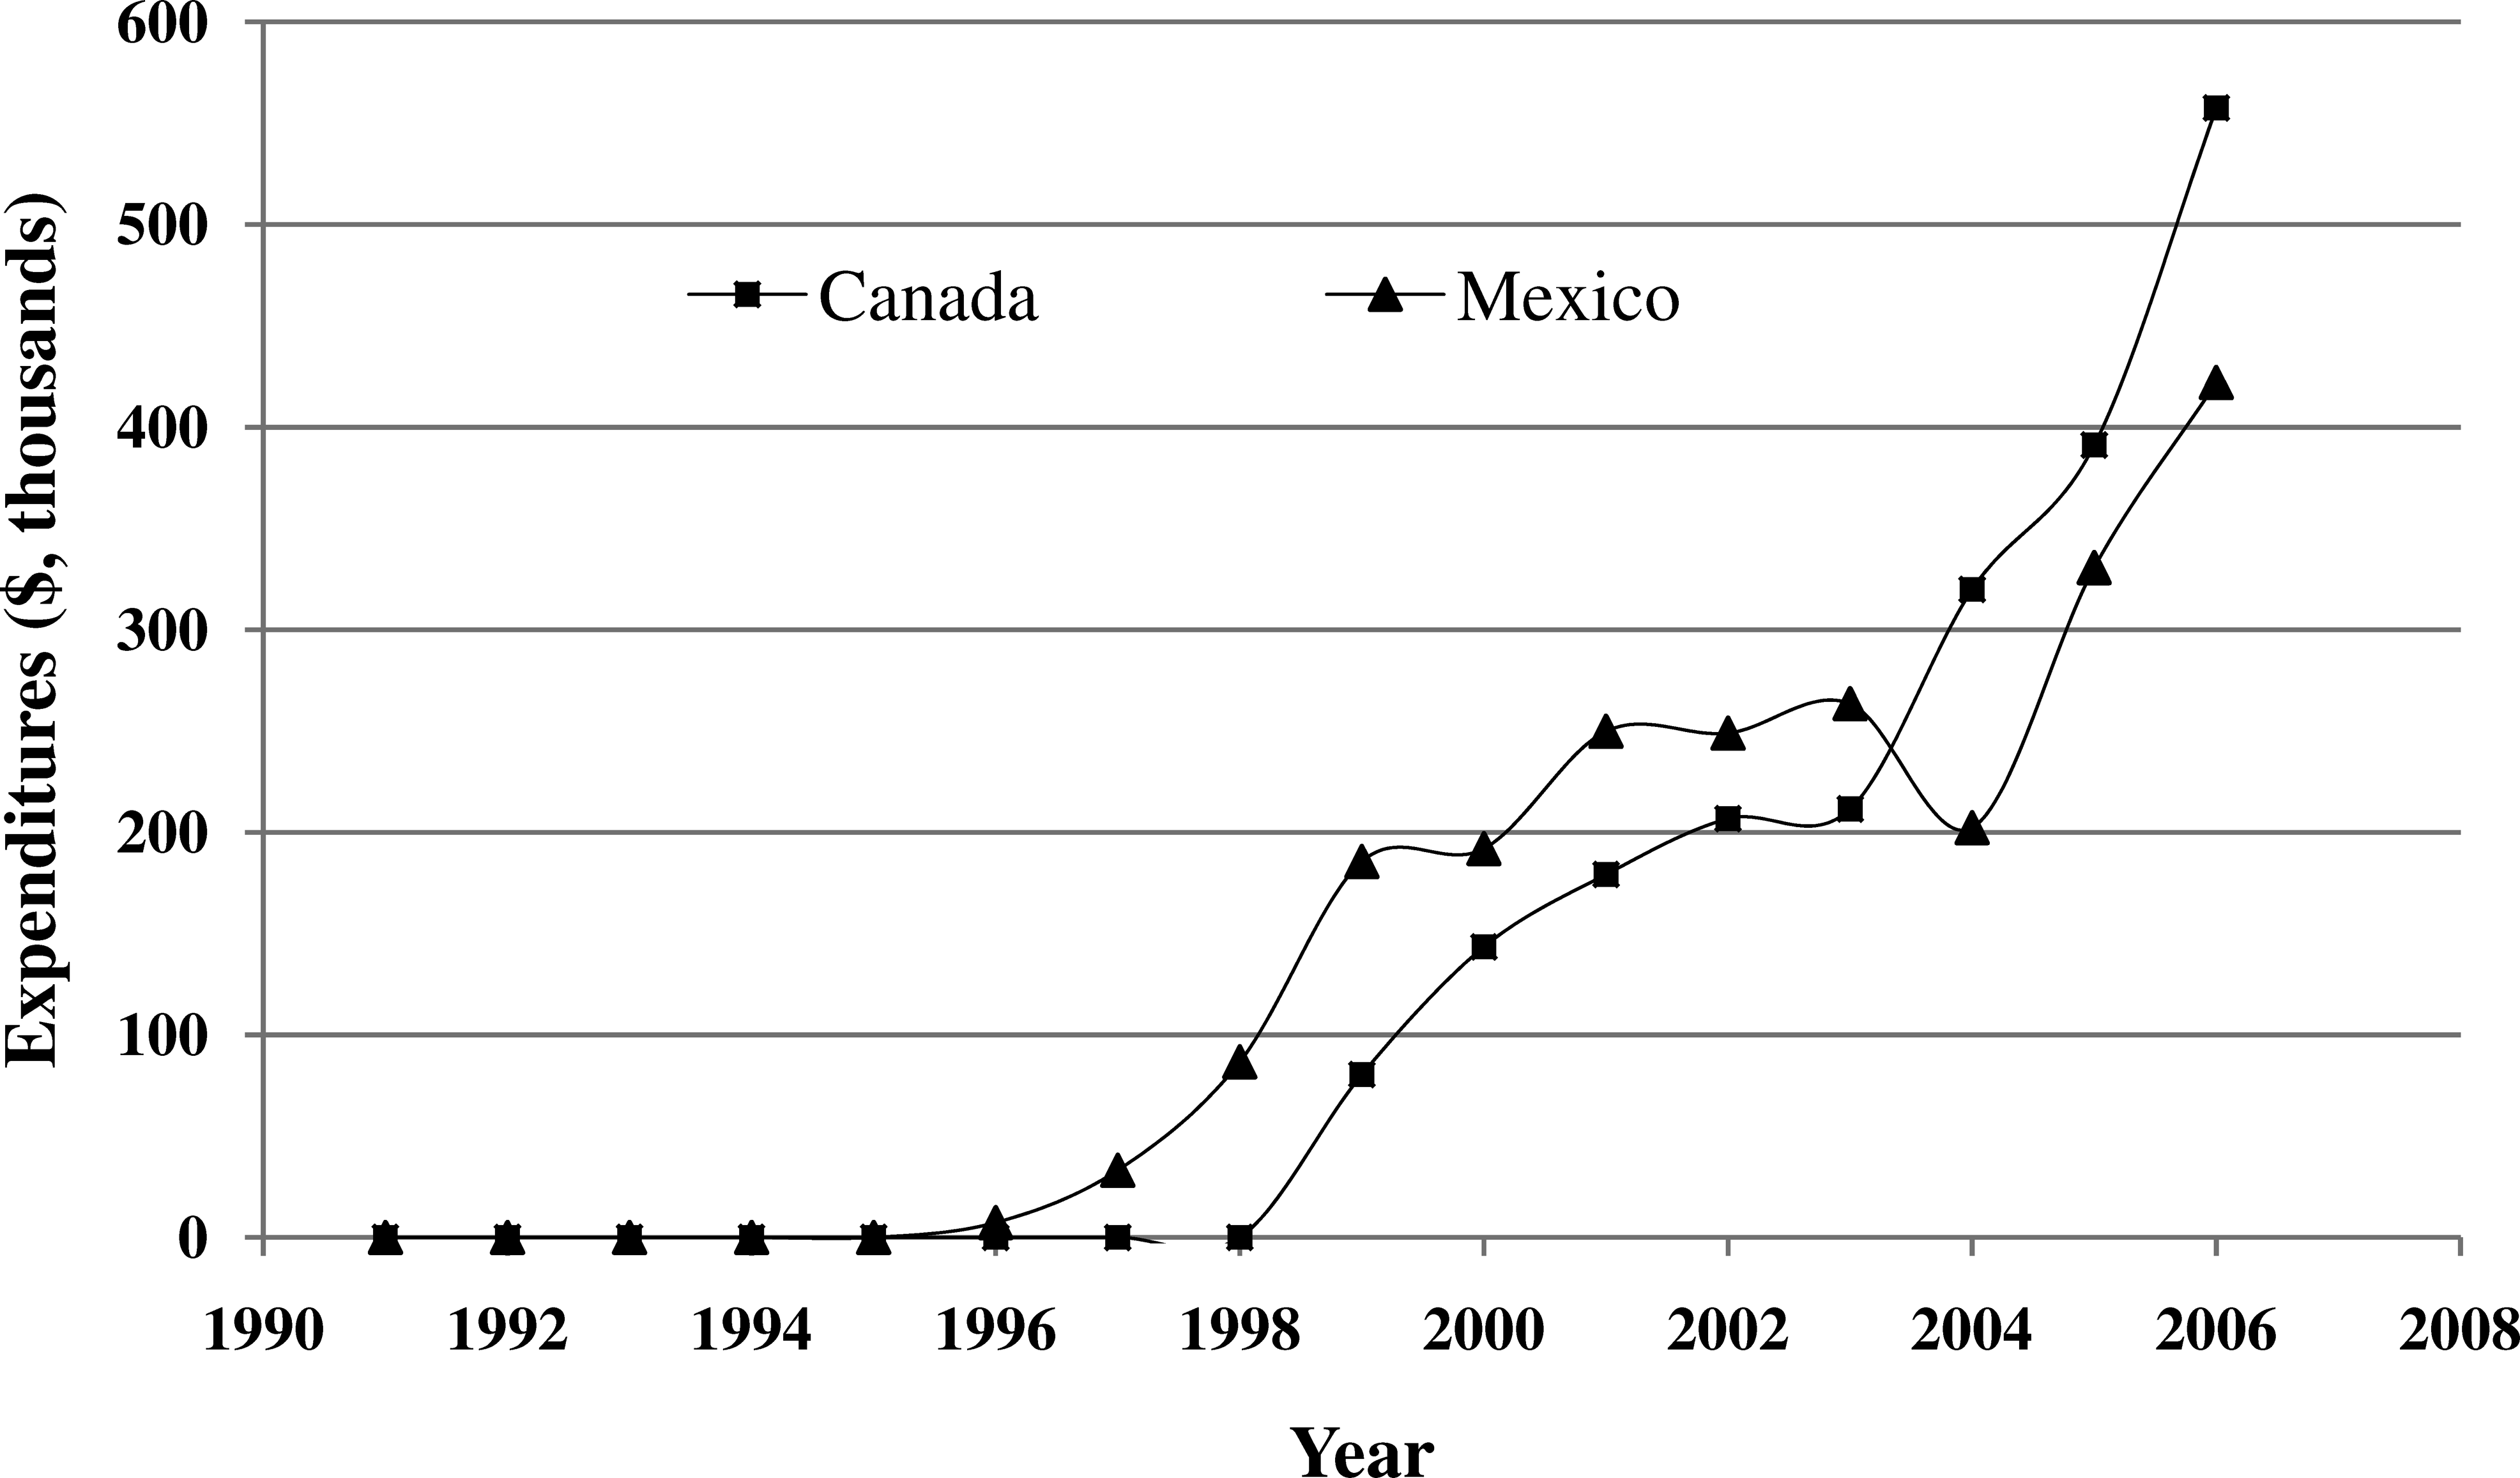
U.S. export promotion expenditures in Canada and Mexico.
While the funding amount for the peanut export promotion programs has had an upward trend since the 1990s, U.S. peanut exports to Canada and Mexico have fluctuated (Fig. 2). Hence, the effectiveness of the peanut exports federal promotion efforts has been questioned. Without a formal evaluation of the export promotion programs, it is difficult to address the effectiveness of these programs on peanut exports. Therefore, the main objective of this study was to evaluate the effect of U.S. export promotion expenditures on U.S. peanut exports to Canada and Mexico. These two destinations collectively imported about 52% of total U.S. peanut exports in 2006. This study also analyzes the impact of other major factors affecting the demand for U.S. peanut exports to Canada and Mexico including U.S. peanut price, the price of peanuts from other exporting countries, the income level in the importing countries and the exchange rate.
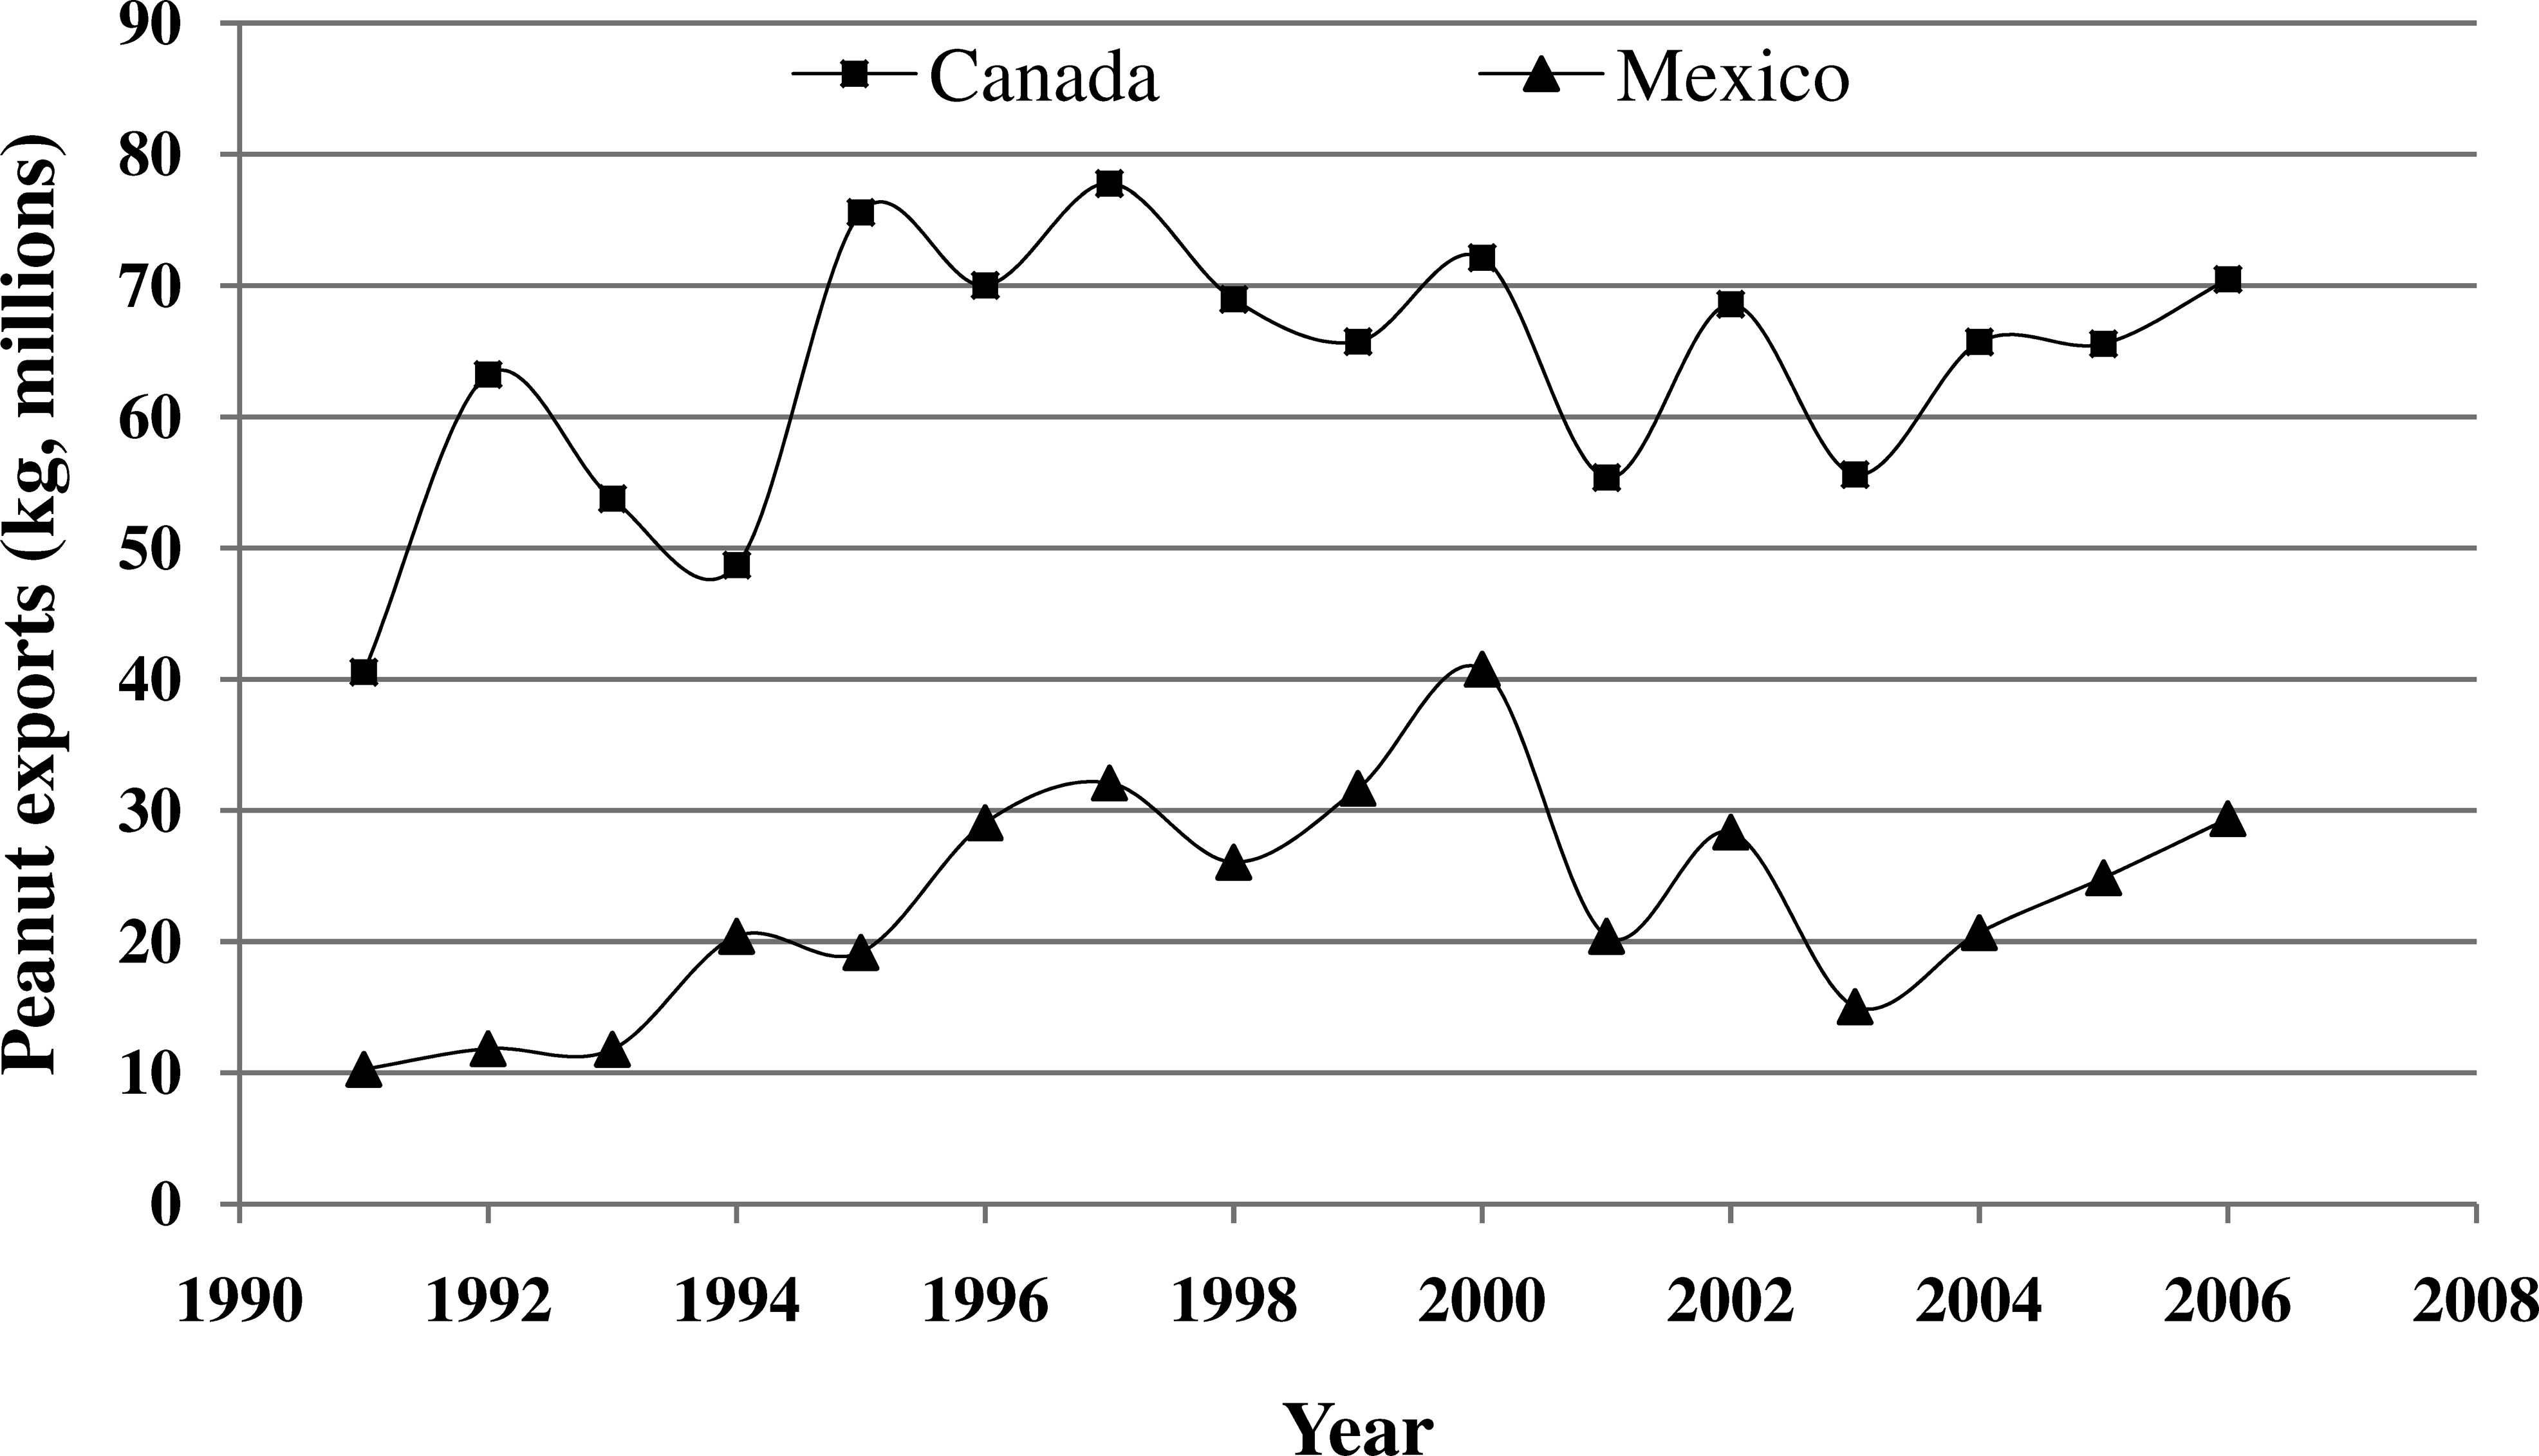
U.S. peanut exports quantity to Canada and Mexico.
U.S. Peanut Exports and U.S. Agricultural Peanut Policy
During the early 1980s through the early 1990s, the U.S. was the largest peanut exporter accounting for about one-third of world trade in peanuts (Halliburton and Henneberry, 1993). However, U.S. peanut exports have been on a downward trend since the early 1990s, with the gap being filled largely by lower priced peanuts from Argentina and China (Dohlman et al., 2004). In fact, during the 2000s, China's peanut exports accounted for around 30–40% of the global market share, three to four times above the level of U.S. exports which were about 10–15% of world trade (PSD online, USDA).
Declining U.S. peanut exports have put pressure on domestic producers to become more competitive in the world peanut market. Moreover, the Uruguay Round Agreement of GATT (WTO) signed by the U.S. forced a cut in trade-distorting domestic support to the agricultural sector. In addition, trade agreements such as the North American Free Trade Agreement (NAFTA) prompted the removal of non-tariff trade barriers and lowered tariffs in a move towards free trade. These trade agreements required the U.S. Farm Bill peanut program to drastically change from the marketing quota (i.e., supply management) program to the Marketing Loan Program in 2002.
Under the marketing quota program, additional (non-quota) peanut producers had exported a significant amount of peanuts, with exports typically accounting for 15–25% of overall production (Dohlman et al., 2004). The elimination of the marketing quota program in 2002 allowed non-quota production formerly produced for export to be marketed domestically. Hence, the change in U.S. farm policy in 2002 replacing the quota system with the Marketing Loan Program affected not only U.S. peanut production and consumption, but also U.S. peanut exports.
The North American Peanut Market
The U.S. is the main exporter of peanuts in North America. The percentage of U.S. peanut exports to Canada and Mexico has risen over time from 19% of the U.S.'s total export quantity in the early 1990s to 52% of the U.S.'s total export quantity in 2006. Canada has no peanut production and Mexico is a small producer of peanuts with production of only 70 million kg in 2006–2007, well below the U.S. production of 1,571 million kg during the same time period. Canada eliminated all import duties on peanuts under the Canada-U.S. Free Trade Agreement (CUSTA). Mexico is a net importer of U.S. peanuts and has no trade barriers on peanut imports from the U.S. Mexico had only a 20% duty on peanut butter which was eliminated by 2003 due to NAFTA, signed in 1994.
According to U.S. Trade Internet System (FAS online) database of the USDA FAS (Table 1), U.S. peanut exports to Canada increased over time until peaking at 77.78 million kg in 1997. Subsequently, U.S. peanut exports to Canada fluctuated widely, ranging from 55.37 to 72.14 million kg between 1998 and 2006. U.S. peanut exports to Mexico have increased over time reaching 40.77 million kg in 2000. After 2000, U.S. peanut exports to Mexico have oscillated.
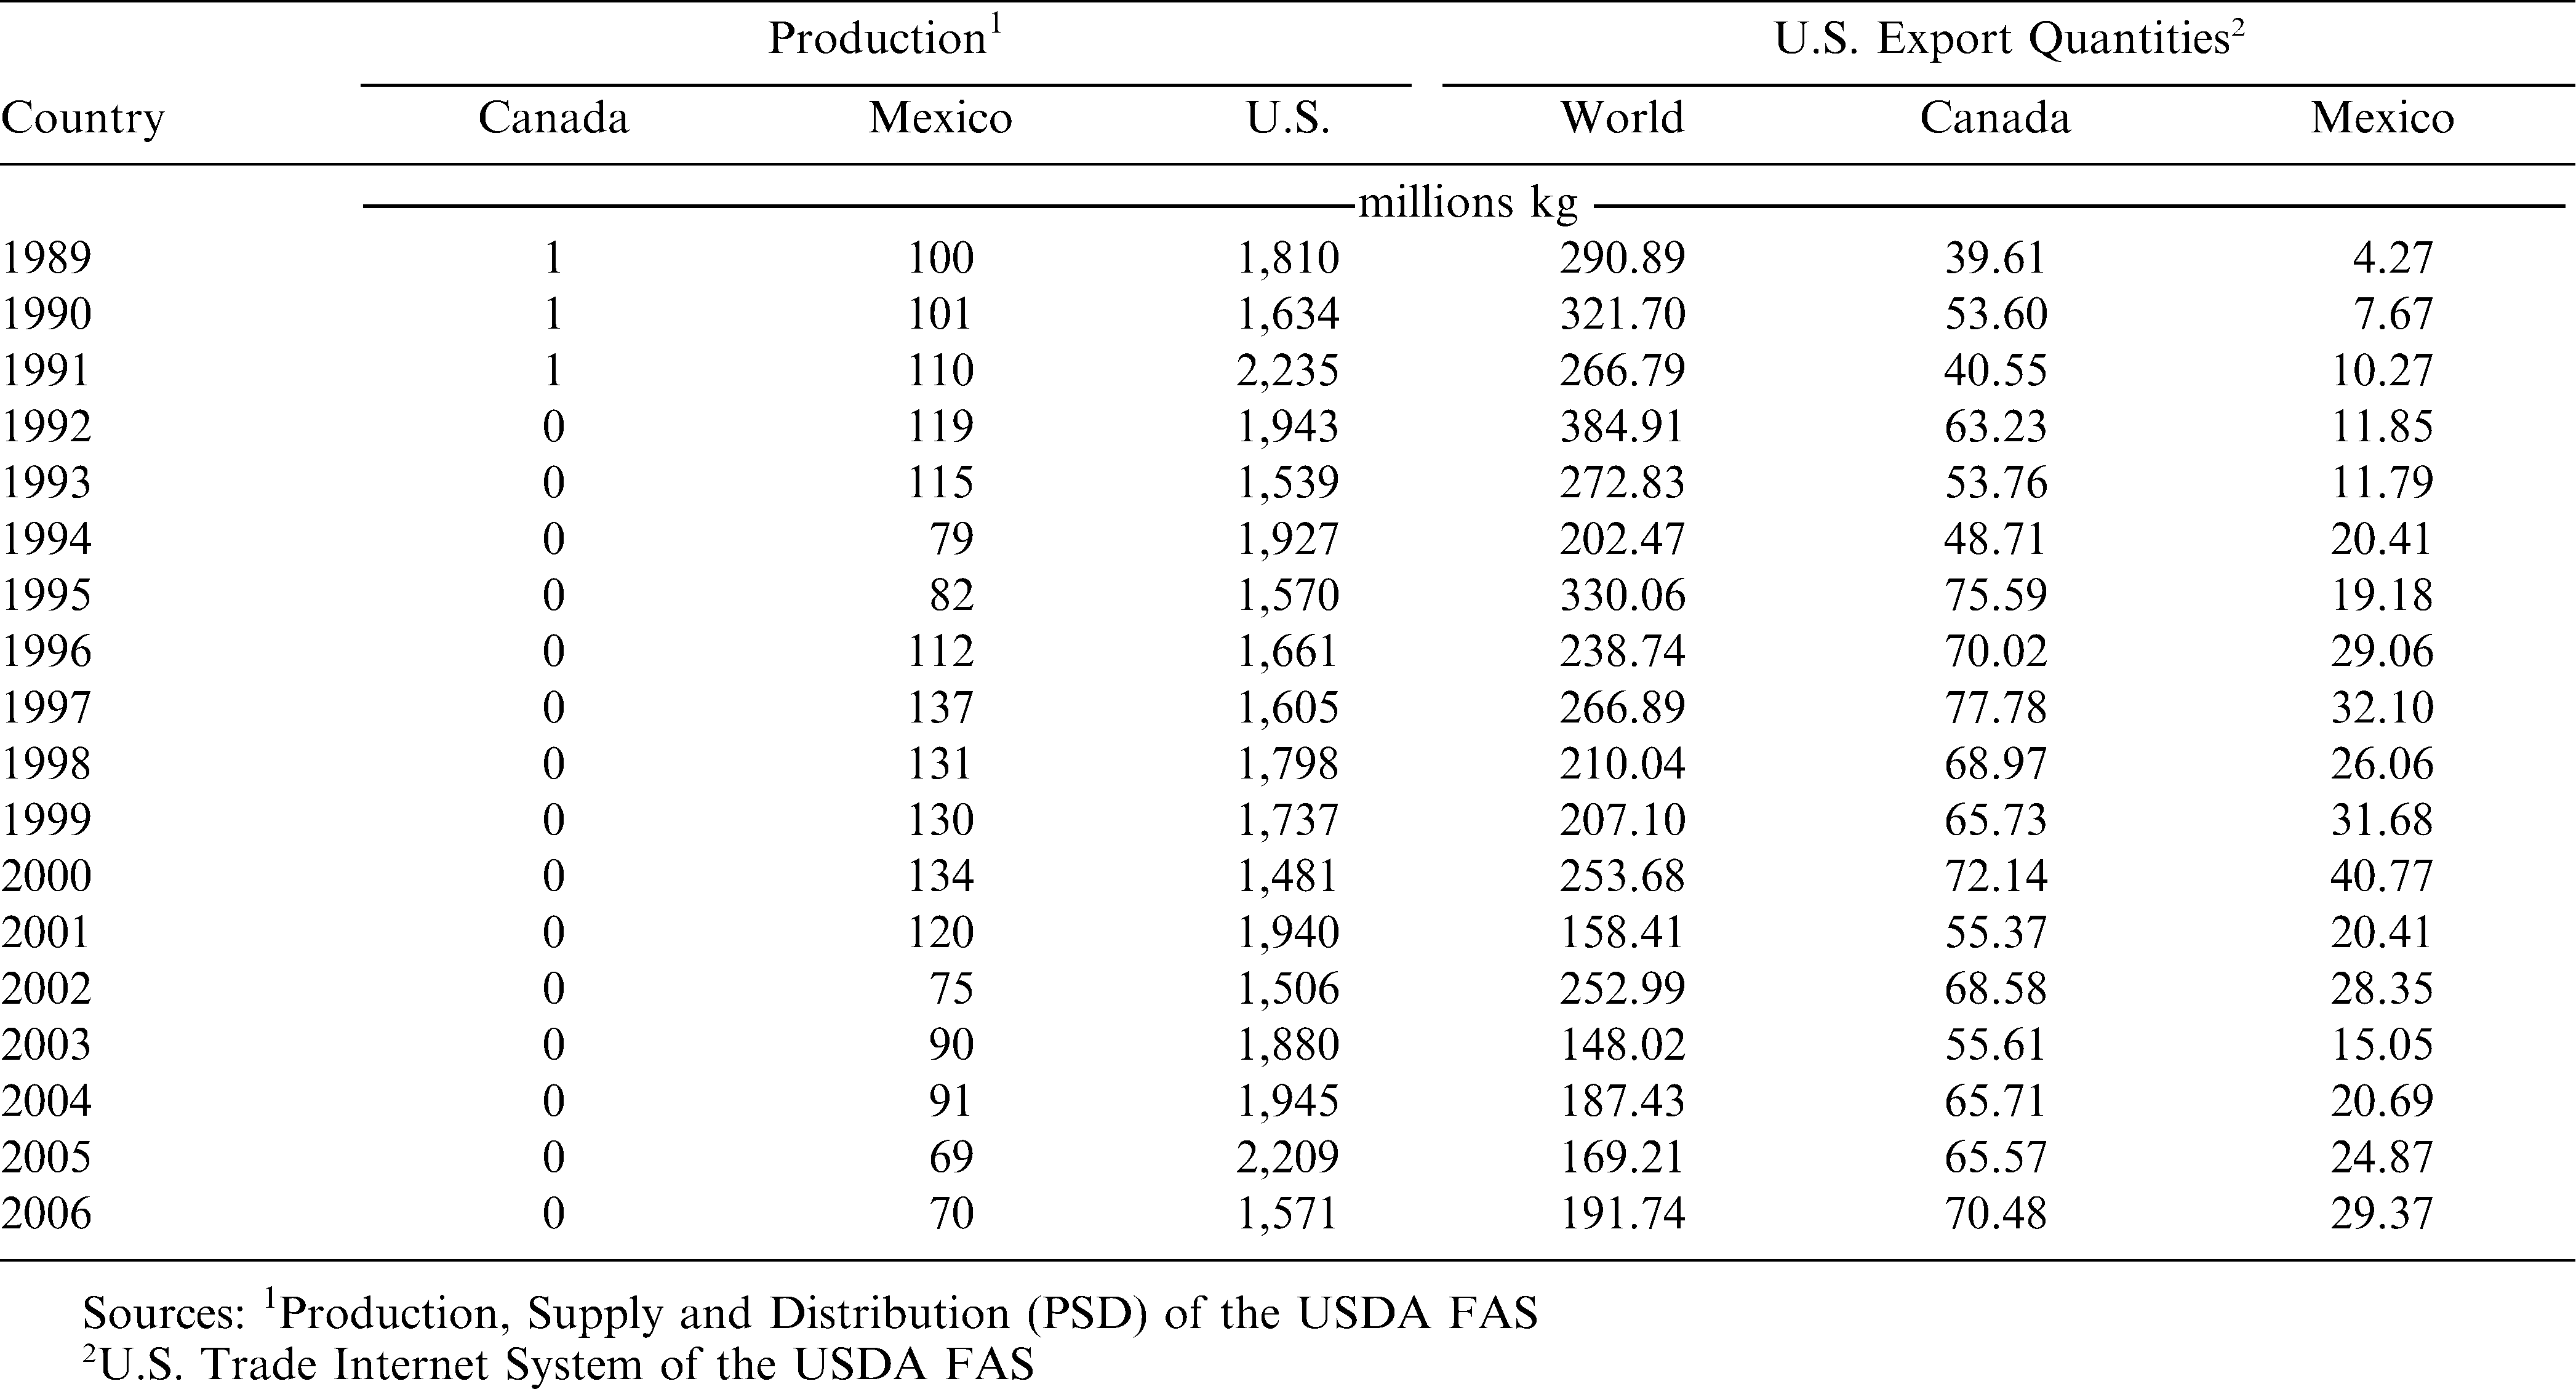
Peanut production in North American countries and U.S. export quantities to the world, Canada, and Mexico.
Literature Review
Several studies have examined the effectiveness of export promotion programs on various agricultural commodities in different importing countries (Table 2). For example, studies were conducted analyzing the impact of export promotion programs on apples in Singapore and the United Kingdom (Richards et al., 1997); red meat in Hong Kong, South Korea, Singapore and Taiwan (Le et al., 1997); cotton in the Pacific Rim (Solomon and Kinnucan, 1993); U.S. orange juice in the European Market (Lee and Brown 1986); apples, poultry, and tobacco (Rossen et al., 1986); U.S. fresh grapefruit in Japan, France, Canada, and the Netherlands (Fuller et al., 1992); U.S. frozen concentrated orange juice in France, Germany, Japan, the Netherlands and the United Kingdom (Armah and Epperson, 1997); almonds in Japan, Korea, Taiwan, Hong Kong and Singapore (Halliburton and Henneberry, 1995; Kinnucan and Christian, 1997); and pecan in Asia and the European Union (Onunkwo and Epperson, 2000). In general, these studies found that U.S. export promotion had a positive impact on U.S. exports.
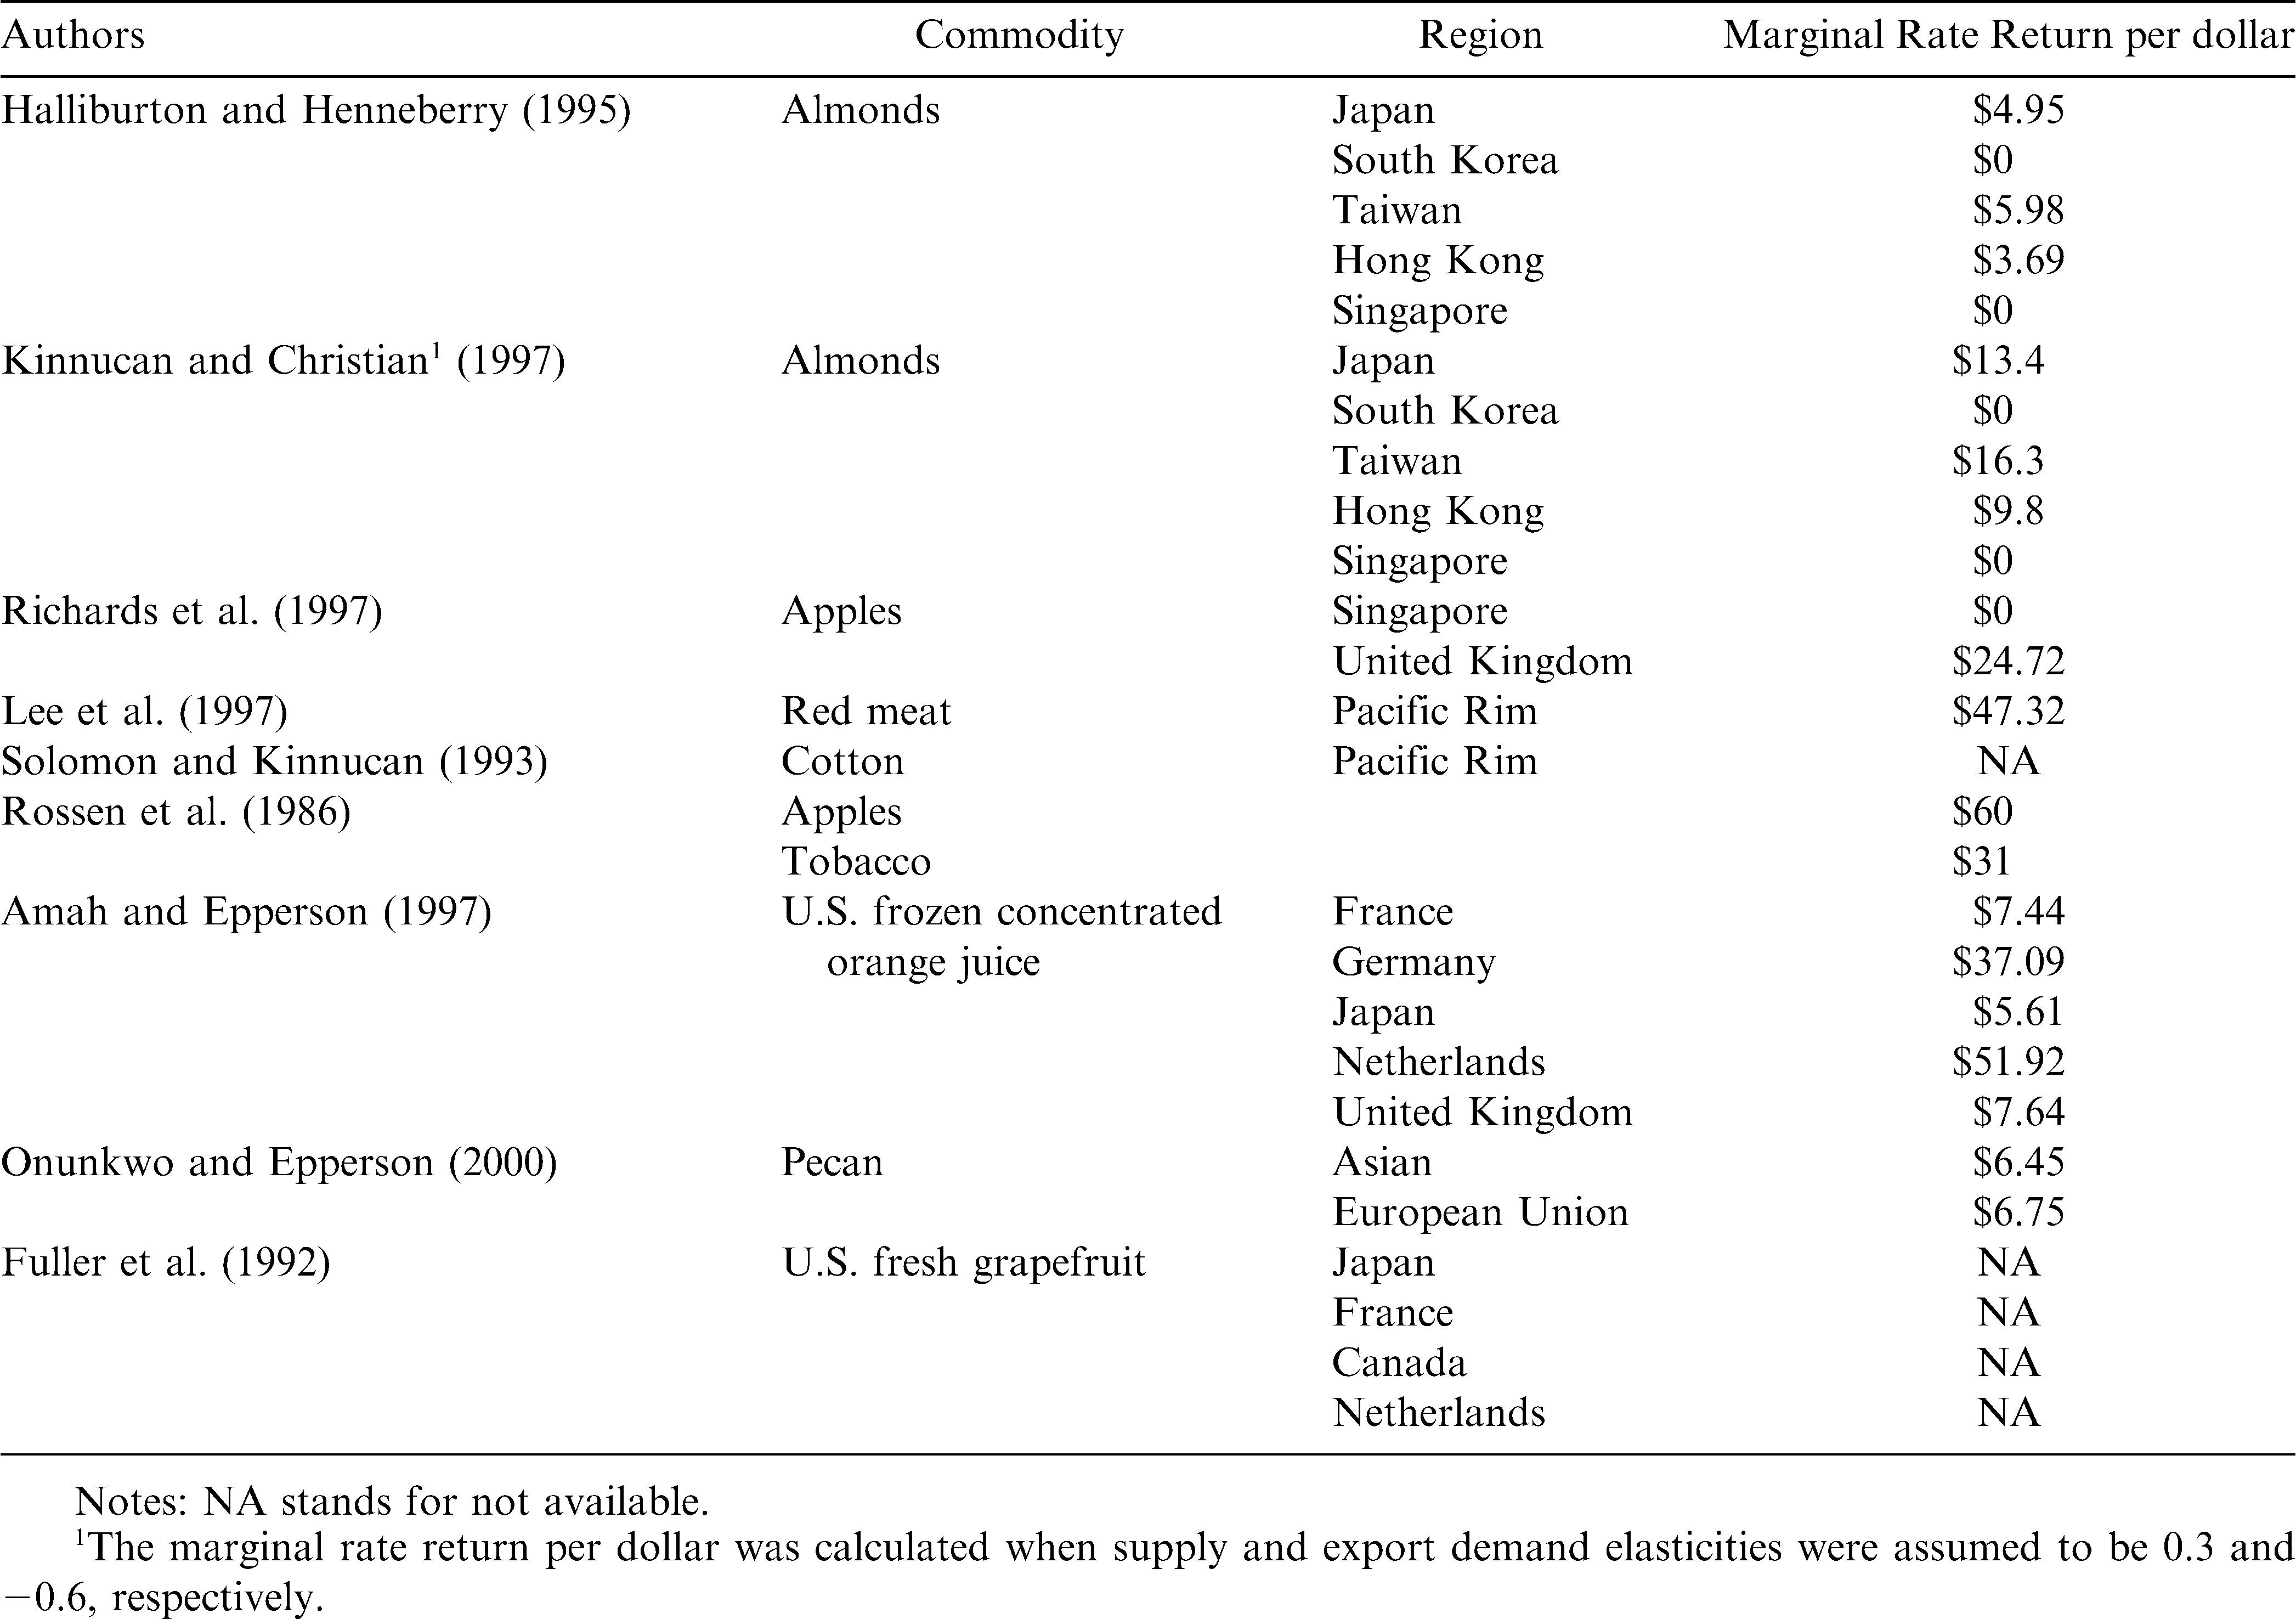
Summary of studies evaluating U.S. export promotion programs.
Table 2 summarizes the results of previous studies analyzing the effectiveness of U.S. export promotion programs for several commodities and regions. Estimates of marginal rates of return for the export promotion programs ranged from $30 to $60 per dollar spent. In addition, the degree of effectiveness of export promotion programs appears to be commodity and region specific. The only study that looked at export promotion programs for peanuts is one by Halliburton and Henneberry (1993). However, these authors only reported the allocation of U.S. export promotion program expenditures for peanuts among regions and activities and did not analyze the effectiveness of these programs.
Materials and Methods
Theoretical Model and Construction of Variables
According to economic theory the quantity demanded for a good is a function of its price (own price), the price of other goods, income and other variables such as advertising which affect consumers tastes and preferences. Hence, our model assumes the per capita quantity of export demand for each importing country depends on the own price, the price of peanuts from other origins, Gross Domestic Product (GDP) and promotion expenditures. Our model specification also includes the exchange rate as an explanatory variable which is a unique feature of export demand models (e.g., Fuller et al., 1992; Armah and Epperson, 1997; and Le et al., 1997). In equation form, the general model of export demand for U.S. peanuts in any importing country
 can be written as:

The dependent variable (
 ) represents the total volume of U.S. peanuts exports to the importing country
 in kg. The export price of U.S. peanuts (
 ) and the price of peanuts from other exporting countries (
 ) are in U.S. dollars per kg. GDP (
 ) in dollars is included in the model as a region-specific explanatory variable for the importing country
 . The exchange rate of the importing country
 (
(
 ) is expressed in units of dollar per domestic currency of the importing country
 . The U.S. export promotion expenditures on peanuts in the importing country
 (
(
 ) is expressed in units of U.S. dollars. Other region-specific variables are the indices of consumer prices in the importing region (
 ) and the United States (
 ).
).
 is the total population of the importing country
 . The subscripts
 ,
,
 , and
, and
 denote the importing country, the United States, and the year, respectively. As seen in equation (1) the quantity of peanuts demanded, GDP and promotion expenditures used in this model are in per capita terms. Moreover, all the prices, the exchange rate and expenditures are expressed in real terms (i.e., they take into account the effect of inflation).
Econometric Model
Assuming a linear functional form corresponding to equation (1), the time series regression models of the export demand for U.S. peanuts for Canada (Eqn. 2) and Mexico (Eqn. 3) can be specified as follows:
where
 , …,
, …,
 .
.
The subscripts
 and
and
 refer to Canada and Mexico, respectively. The terms
 and
and
 are the error terms. The number
 is the total number of time series observations in each country. Since Argentina and China are the main competitors of U.S. peanut exports, equations (2) and (3) include the export prices of Argentinean and Chinese peanuts (Ps) in U.S. dollars per kg. The subscripts
 and
and
 in Ps denote China and Argentina, respectively. The 2002 Farm Bill dummy (FB) is a dummy variable intended to capture the elimination of the longstanding peanut marketing quota system. This variable takes the value of 0 for the years 1991–2002 and 1 in years 2003–2006.
For estimation purposes, a single-equation method was used (i.e., the data for the different countries was pooled) because of the limited number of observations available on data for individual countries. This method has been utilized in several studies (e.g., Halliburton and Henneberry, 1995; Armah and Epperson 1997; Le et al., 1997; and Onunkwo and Epperson, 2000). All the
 observations (
 time series observations for two countries) were merged, and then the export demand for U.S. peanuts was estimated as a single demand equation2. Hence, the empirical pooled model of the export demand for U.S. peanuts was specified as follows:
where
 for observations on Mexico and 0 otherwise.
Dummy shifters (D) were intended to measure and test the differences in the intercept as well as in the effect of all the other explanatory variables on U.S. peanut exports between Mexico and Canada. For example, the parameter β 1 is the marginal effect of the export price of the U.S. peanuts on the quantity demanded for U.S. peanuts in both Mexico and Canada. The parameter β 6 is included to allow for different marginal effects between Mexico and Canada. Specifically, the null hypothesis that H0: β 6 = 0 means that the marginal effect of the export price of U.S. peanuts is the same in both countries. Hence, if we reject the null hypothesis, the marginal effect of the export price for U.S. peanuts in Canada is β 1 whereas than the marginal effect of the export price for U.S. peanuts in Mexico is β 1+β 6. The export demand equation is specified with dummy shifters so that the effects of export prices of U.S. peanuts, promotion, GDP and exchange rate can differ by country.
The effect of the export price of U.S. peanuts (also called own price effects) on quantity demanded is expected to be negative according to demand theory. In other words, an increase in the export price of U.S. peanuts is expected to decrease the quantity of U.S. demanded in the importing countries. The influence of income on export demand is expected to be positive because a higher level of income allows for increased expenditure on U.S. peanut exports. The effects of the export prices of Argentinean and Chinese peanuts3 (also called cross price effects) which are substitutes for U.S. peanuts should be positively related to the quantity of U.S. peanut exports. This implies that as prices for the substitute goods (i.e., Argentinean and Chinese peanuts) rises, their quantity demanded by consumers decline. Consequently, the export demand for U.S. peanuts increases.
Regarding the real exchange rate variable (U.S. dollar per foreign currency), peanut export trade is denominated in U.S. dollars. Thus, a decrease in the exchange rate means the importer pays more of his currency for the same quantity of imports. This implies a higher price, hence, quantity demanded of U.S. exports decreases. Given this relationship, a positive relation was expected between exchange rates and quantity demanded of U.S. exports of peanuts.
Data
All data used in the study are on an annual (calendar year) basis from 1991 to 2006. Export quantities and values of peanuts for importing country were obtained from the USDA FAS U.S. Trade Internet System. Unit prices of U.S. peanuts in Canada and Mexico were computed by dividing U.S. export value by U.S. export quantity in Canada and Mexico. The U.S. dollar export promotion expenditures for peanuts in Canada and Mexico were provided by the American Peanut Council (APC). Exchange rate between U.S. dollar and domestic currency of the importing country, and population data for Canada and Mexico were from the online publication “Source OECD: Main Economic Indicators”. GDP and Consumer Price Index (CPI) data of U.S., Canada and Mexico are from “Source OECD: National Accounts Statistics”. Chinese and Argentinean unit prices of peanuts are computed by dividing export value by export quantity of Chinese and Argentinean peanuts. Due to limitation of data by FAS, export quantities and values of Chinese and Argentinean peanuts are from the EUROSTAT database (EUROSTAT).4
Results and Discussion
The regression results of the export demand equation for U.S. peanuts to Canada and Mexico are shown in Table 3. The measure of goodness-of-fit for the estimated equation was 0.98. This measure as well as the graph of the relationship between the actual and the predicted value of per capita U.S. peanut exports to Mexico and Canada (Fig. 3), indicate that the model has a good explanatory power. An F-test was used to test the overall significance of the estimated regression. The null hypothesis of the F-test was that all the slope coefficients are simultaneously equal to zero. The calculated F-statistic equals 110.71 which is higher than the critical value at the 1% level of significance so the null hypothesis was rejected. As shown in table 3, the statistical significance tests of the parameters corresponding to interaction terms between the dummy variable for Mexico and the own price (
 ), GDP (
 ), exchange rate (
 ) and export promotion expenditure (
 ) variables suggest that: a) changes in U.S. peanut prices and export promotion expenditures have different effects on the demand for U.S. peanuts in Canada and Mexico; and b) the effect of income and exchange rate on the demand for U.S. peanut exports is similar in both countries.
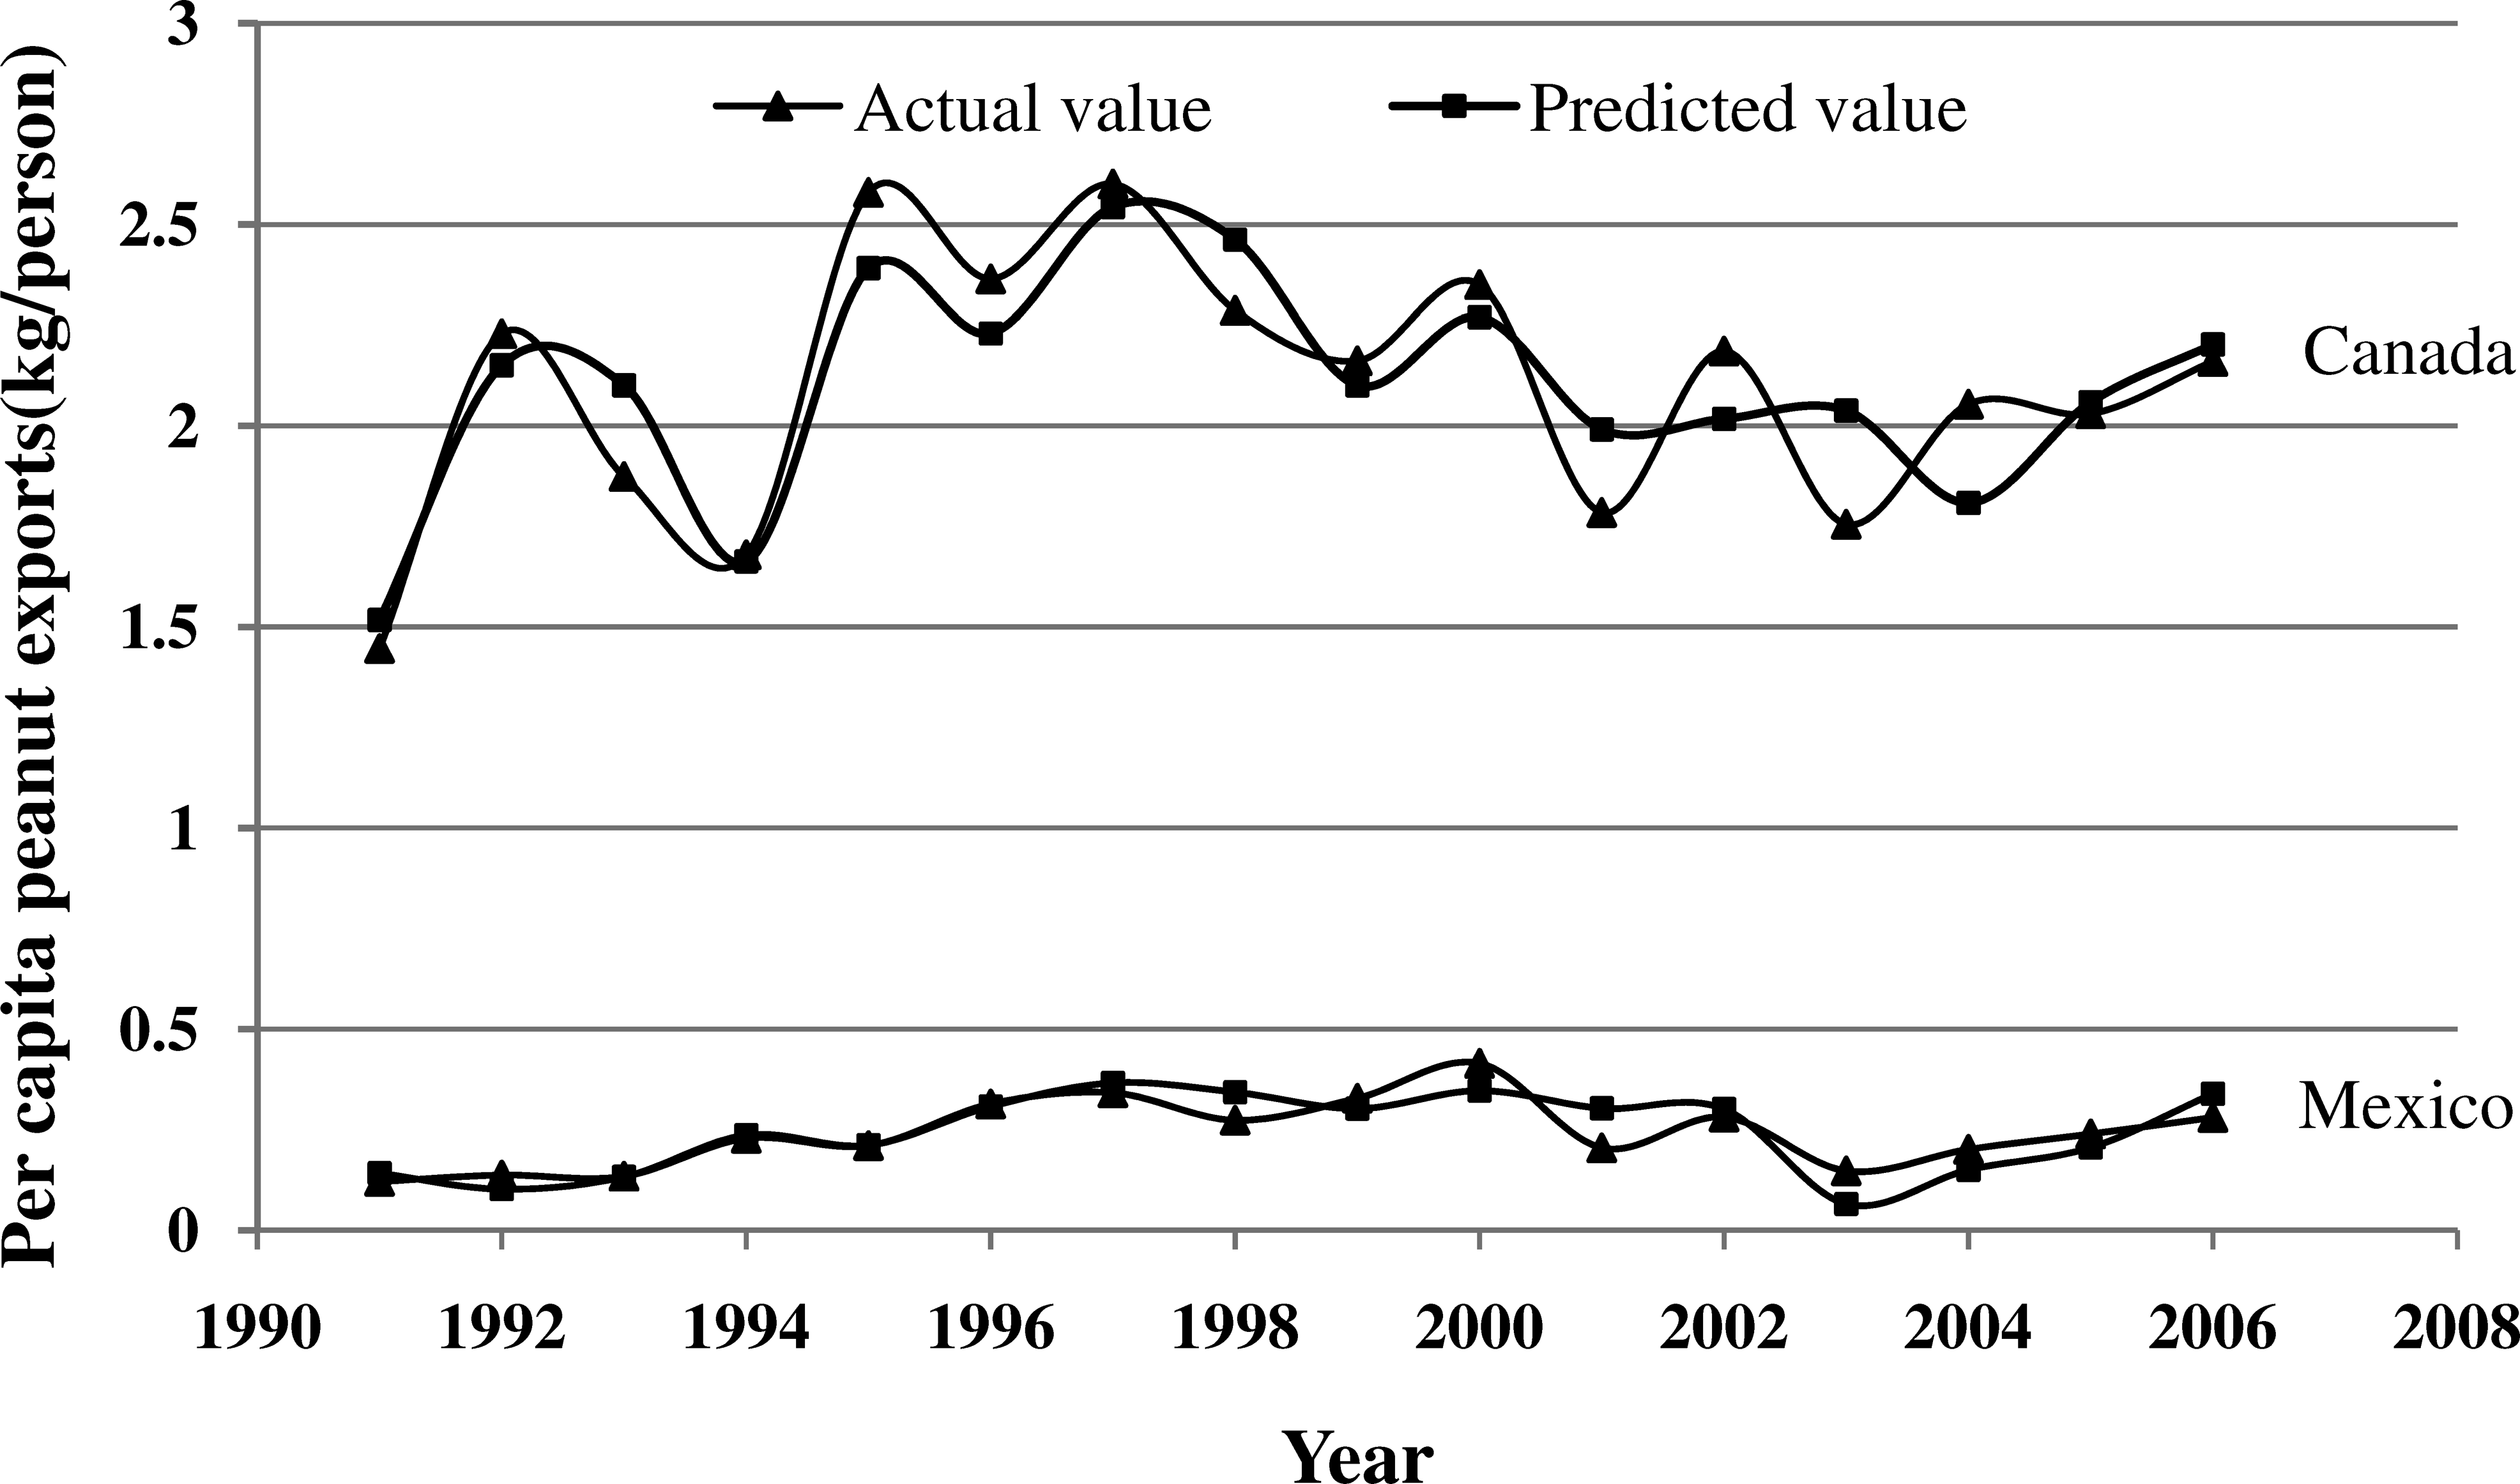
Relationship between actual and predicted U.S. peanut exports to Canada and Mexico.
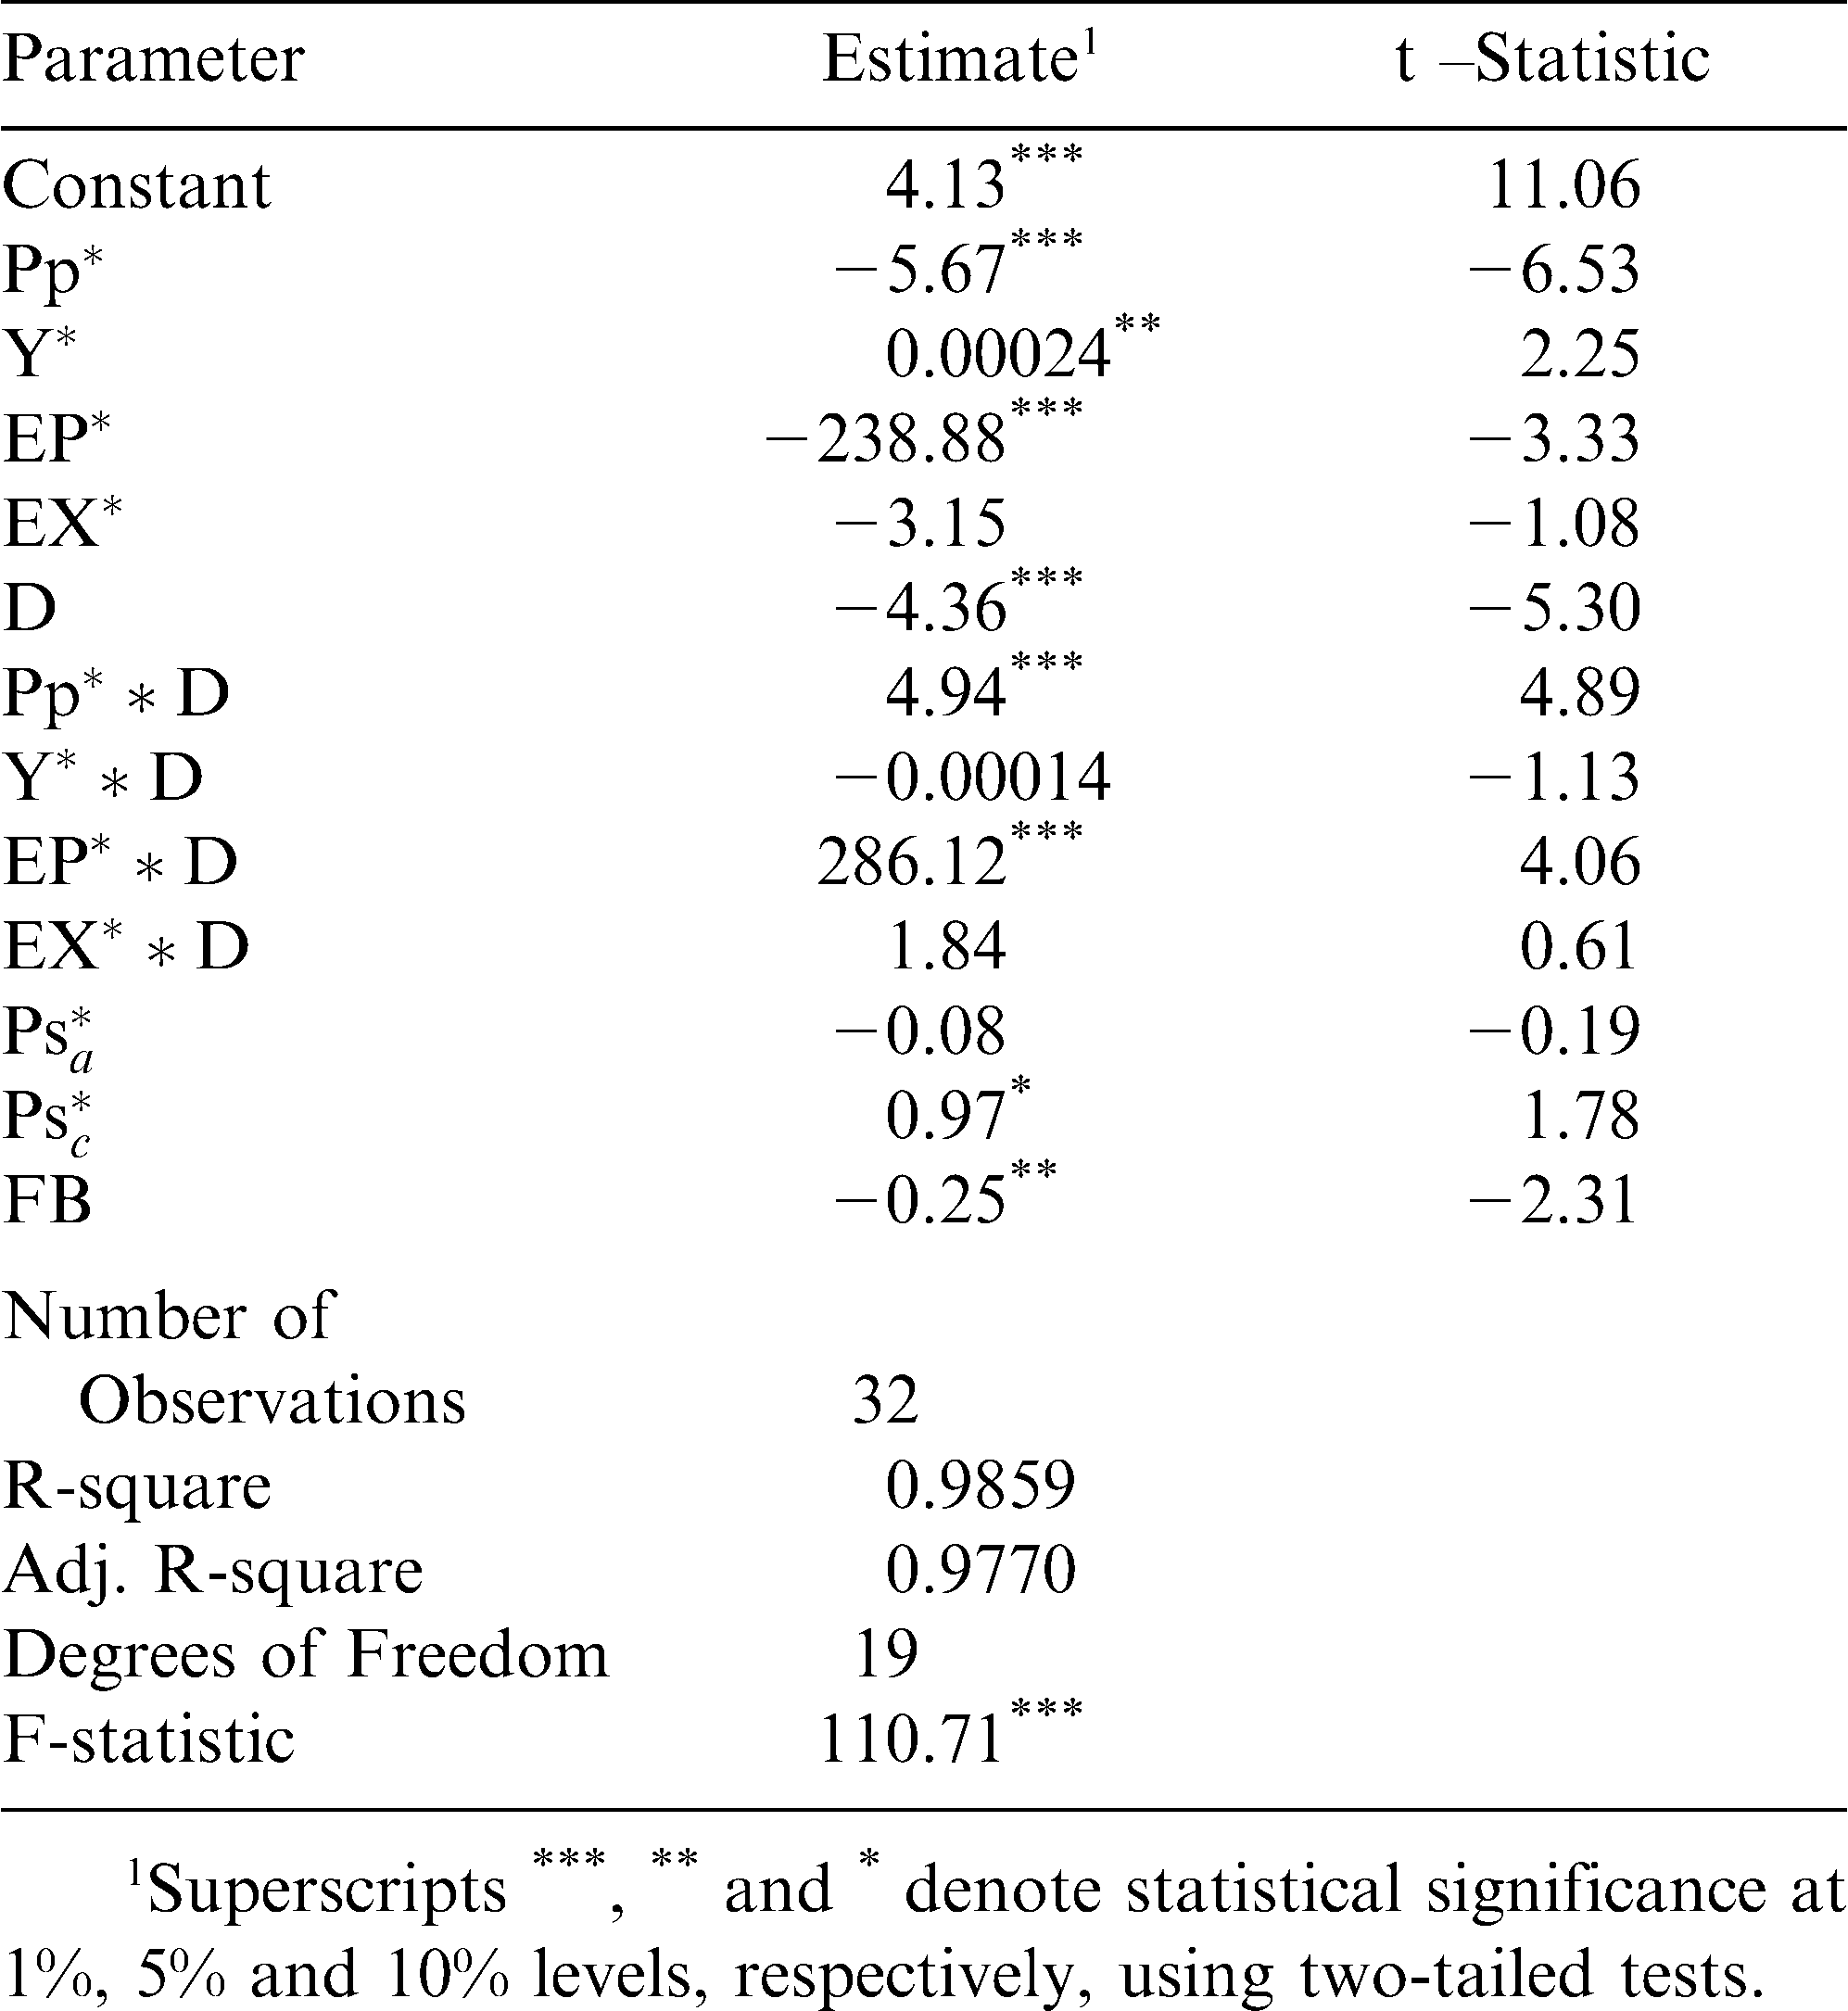
Parameter value estimates and t-statistics for estimating export demand for U.S. peanuts.
The dummy variable included to capture the 2002 Farm Bill was found to have a significant and negative effect on export demand for U.S. peanuts. This relationship was expected because the 2002 elimination of the marketing quota program allowed the non-quota production formerly produced for export to be marketed domestically. In addition, this variable also captures the effects of the system used by USDA to administer the program through the national posted price which impacts exports. Regression results also suggest that neither exchange rate nor the price of Argentinean peanuts have a statistically significant effect on the demand for U.S. peanuts in Canada and Mexico.
Using the regression estimates shown in Table 3, the marginal effects and the elasticities of the explanatory variables on the demand for U.S. peanuts (see Table 4) in Canada and Mexico were calculated. Elasticity estimates were obtained with the formula
 where
where
 is the coefficient estimate,
 is the coefficient estimate of the corresponding interaction variable and
 and
and
 are the average values of the explanatory and the dependent variables presented in table 5, respectively. For example, the export price elasticity for U.S. peanuts in Canada equals to
 and the export price elasticity for U.S. peanuts in Mexico equals to
 .
.
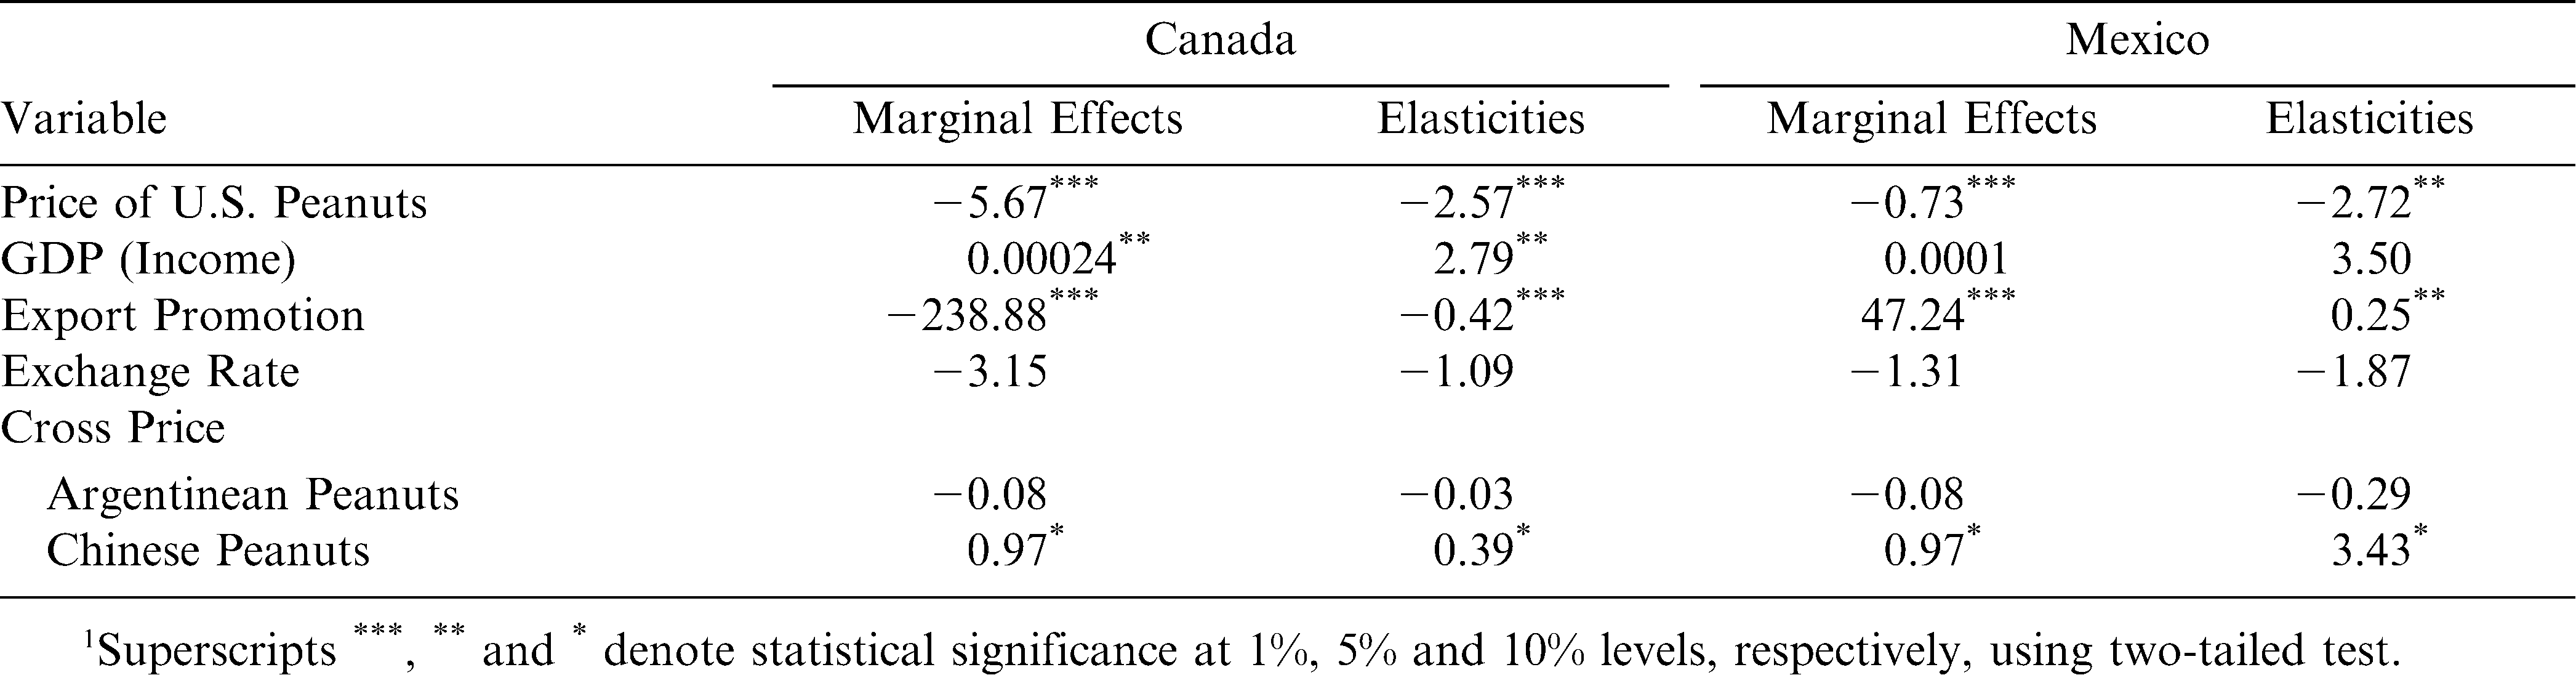
Marginal effects1 and elasticity estimates1 of the explanatory variables on the export demand equation for U.S. peanuts in North America.
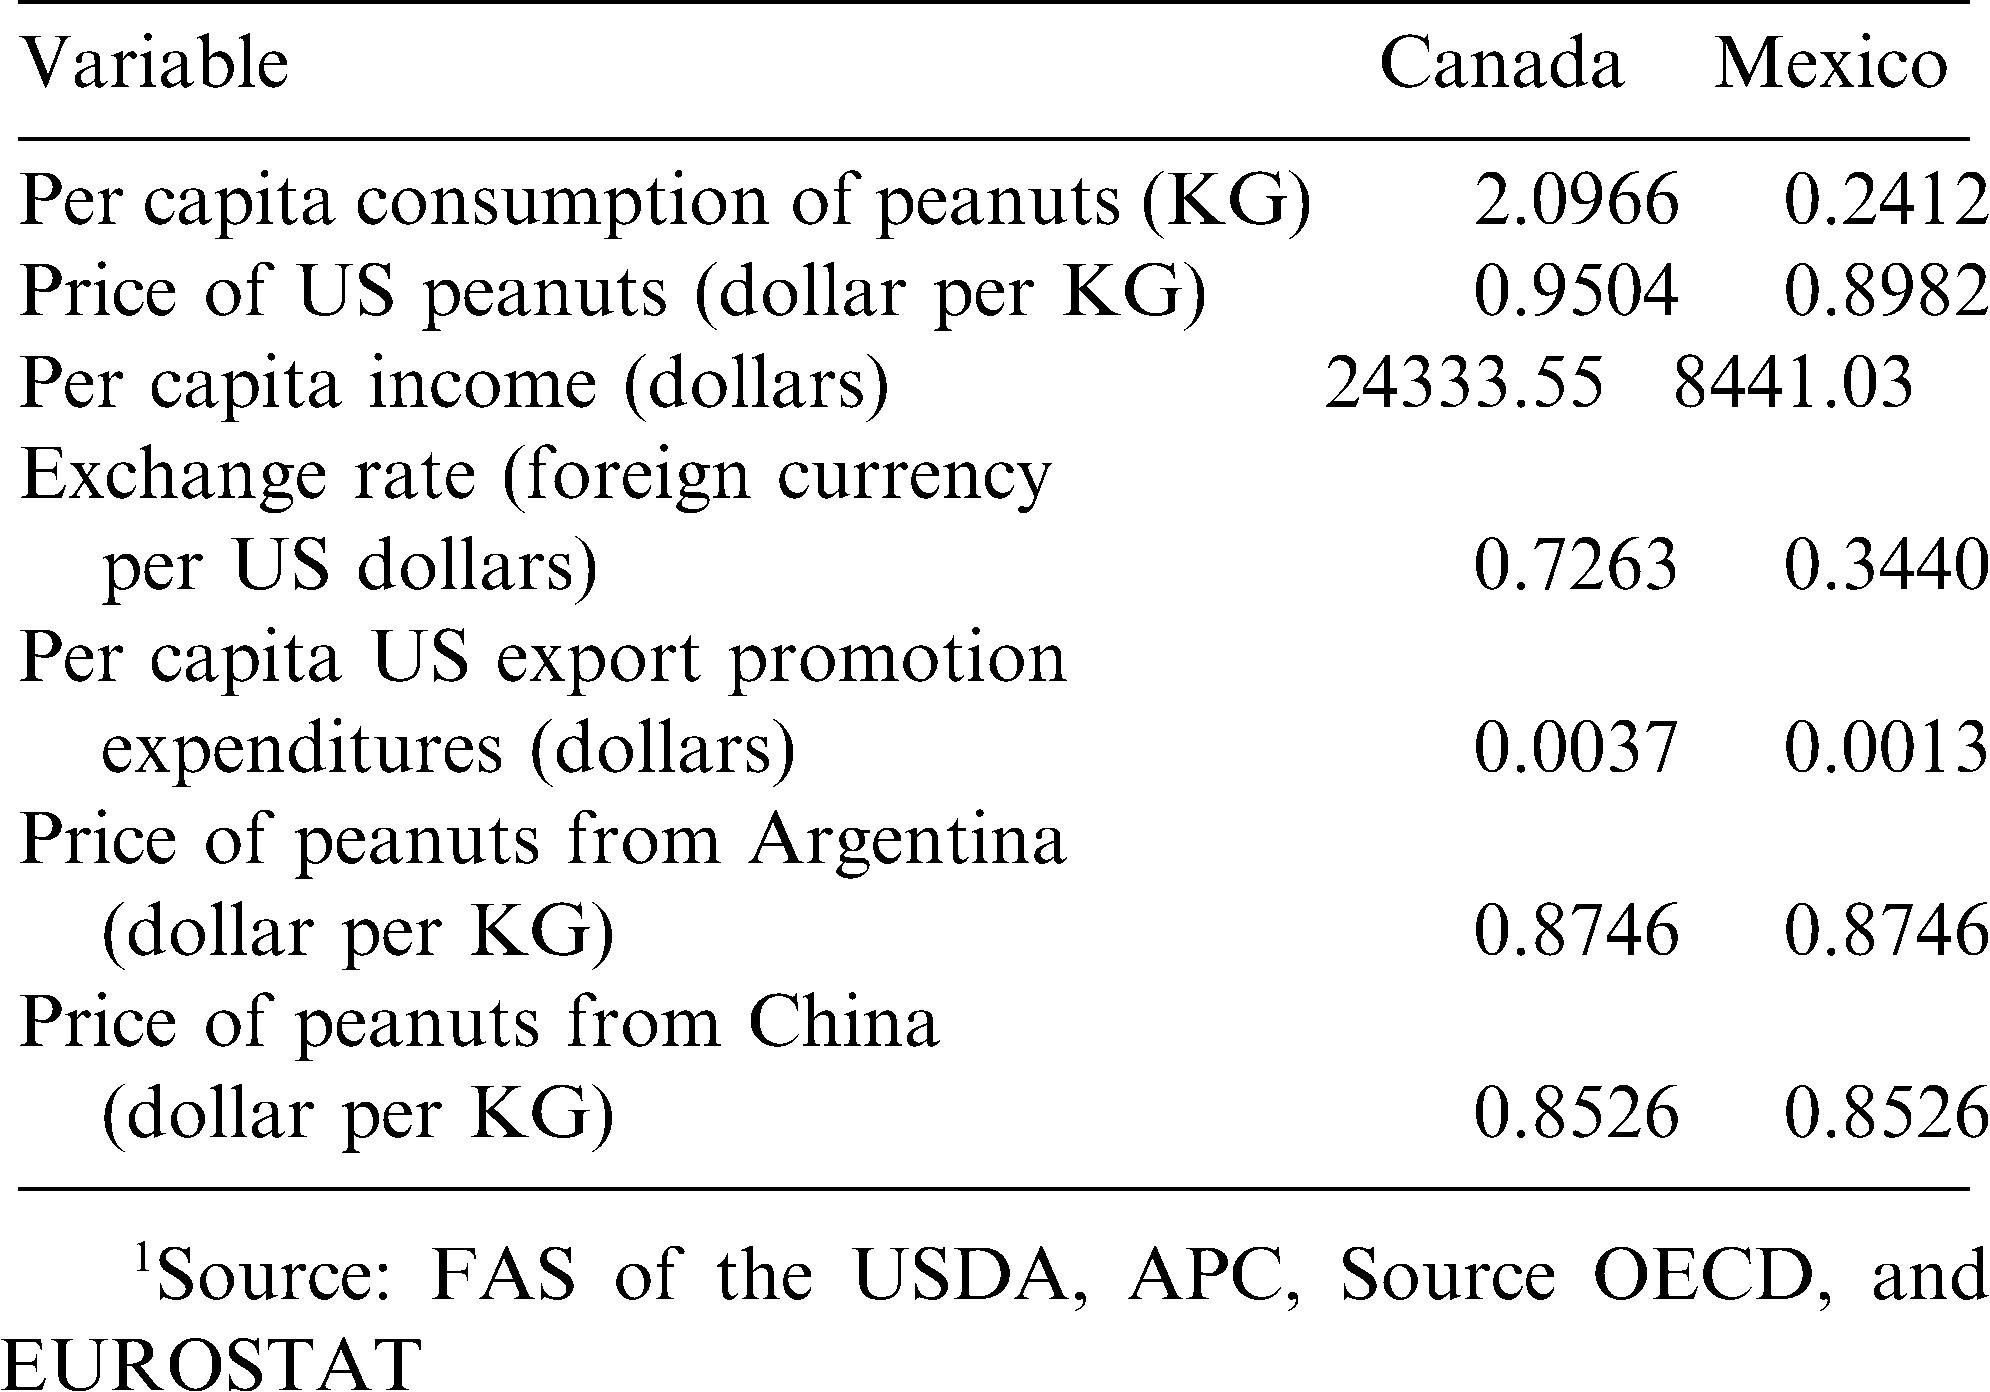
Mean values of variables1 included in export demand model for U.S. peanuts in North America from 1991 to 2006.
The marginal effects measure the impact of one unit change in the explanatory variable on the dependent variable holding all other variables constant. For example, the value of −5.67, which is the marginal effect of the U.S. peanut price on the demand for U.S. peanuts in Canada, indicates that a $0.10 increase in the real price of U.S. peanuts will decrease the per capita demand for U.S. peanuts by 0.567kg.
The elasticities, also shown in table 4, represent the percentage change in the dependent variable given a 1% change in the value of the explanatory variables. For example, the elasticity of −2.57, which is the U.S. price elasticity of U.S. export demand in Canada (own price elasticity), indicates that a 1% increase in the price of U.S. peanuts will decrease the per capita demand of U.S. peanuts in Canada by 2.57%.
Corresponding to the law of demand, both own-price elasticities for U.S. peanut exports were negative and statistically significant in both importing countries. The highly elastic own-price elasticities for U.S. peanut exported to Canada and Mexico (−2.57 and −2.72, respectively) suggest that Canadian and Mexican consumers are highly sensitive to price changes of U.S. peanuts. The Chinese price elasticities of U.S. export demand (also called cross-price elasticities) in Canada (0.39) and Mexico (3.43) were positive and statistically significant, indicating that Chinese peanuts are substitutes for U.S. peanuts. These results indicate that if the price of Chinese peanuts increase by 1%, the quantity demanded for U.S. peanuts in Canada and Mexico will increase by 0.39% and 3.43%, respectively. Therefore, there will be a larger increase of U.S. peanuts exported to Mexico than the increase of U.S. peanuts exported to Canada when the price of Chinese peanuts increases. The per capita income elasticity of demand for U.S. peanuts in Canada (2.79) was positive which indicates that consumers in Canada demand more U.S. peanuts when their real GDP per capita increases.
Regarding the peanut promotion elasticities, a positive and statistically significant value for Mexico (0.25) was found. For Canada we found a negative and statistically significant (using a two tailed test) promotion effect (−0.42). However, one can argue that since the sign of the coefficient is determined to be positive by economic theory, a one tailed test should be used in which case the promotion effect is not statistically significant. Furthermore, the negative effect should not be surprising after one examines Figures 1 and 2. Since 1999 when the export promotion started in Canada, U.S. peanut exports have moved around a constant trend line while the export promotion dollars have increased significantly. Hence, these results suggest U.S. export promotion expenditures have had a positive effect on the demand for U.S. peanuts in Mexico but there is no evidence of a positive effect of the promotion efforts in Canada. Other elasticities were not statistically significant.
The promotion impact on peanut exports for Mexico based on the promotion elasticity given in Table 4 was estimated. The marginal return rate per dollar of the export promotion programs for peanuts was $35.92 for Mexico. The marginal return to promotion expenditures was obtained by multiplying promotion elasticity by the ratio of mean imported peanut expenditures to mean promotion expenditures in that country (Halliburton and Henneberry, 1995; Richards, Van Ispelen and Kagan, 1997)5. The determination of the effectiveness of promotion programs is essential to guide the allocation of future funding. According to the marginal return to promotion expenditures, the U.S. peanut industry has substantially benefited from expenditures on export promotion programs in Mexico.
Conclusion
The main objective of this paper was to evaluate export promotion efforts for U.S. peanuts in North America. A single equation method was utilized to estimate the export demand for U.S. peanuts in Canada and Mexico using data from 1991 to 2006. Results of the analysis indicate that the own-price elasticities for U.S. peanut exported to Canada and Mexico were highly elastic (−2.57 and −2.72, respectively). These high elasticity values suggest that Canadian and Mexican consumers are sensitive to price changes of U.S. peanuts. The Chinese cross-price elasticities in Canada (0.39) and Mexico (3.43) were positive, suggesting that China is the main competitor of the U.S. in the Canadian and Mexican markets.
The negative effect of the Farm Bill variable on export demand for U.S. peanuts indicates that implementation of the 2002 U.S. farm policy affected U.S. peanut exports in the short run. However, the change in the U.S. Farm Bill's peanut program will lead to an enhancement of U.S. competitiveness in the world market in the long run by allowing efficient producers to produce peanuts and the inefficient producers to exit. However, this outcome is dependent on USDA's implementation of the U.S. Farm Bill's peanut program (i.e., the setting of the national posted peanut price).
We found evidence that the U.S. export promotion program had a positive effect on the demand for U.S. peanuts in Mexico while these programs seemed to have no effect in Canada. The marginal rate of return of the export promotion programs for peanuts exported to Mexico is 35.92 for every dollar invested in the program. In other words, the U.S. peanut industry receives a return of $35.92 for every dollar of export promotion program expenditures spent in Mexico. This result suggests that the U.S. peanut industry perhaps should consider increasing export promotion funds in Mexico.
The result related to the effect of the export promotion program in Canada is unexpected because the percentage of U.S. peanuts exports to Canada has been rising over time from 15% of the U.S.'s total export quantity in 1991 to 37% of the U.S.'s total export quantity in 2006. The unexpected results may be due to the fact that the export promotion program in Canada started in 1999 and therefore the number of years of data is limited. Furthermore, exports have moved around an almost constant trend line since 1999. Between 1997 and 1999, U.S. peanut exports to Canada were trending downwards. Thus, one view could be that the export promotion dollars stemmed further decreases in U.S. peanut exports to Canada. Further research will have the benefit of more observations to evaluate the effectiveness of U.S. non-price export programs in Canada as well as address the view that the funds helped stem further export declines.
Literature Cited
Armah B. K. and Epperson J. E. 1997 Export Demand for US Orange Juice: Impacts of US Export Promotion Programs. Agribusiness 13 1 : 1 – 10 .
Dohlman E. , Hoffman L. , Young E. , and McBride W. 2004 Peanut Policy Change and Adjustment Under the 2002 Farm Act. Electronic Outlook Report from the Economic Research Service, United States Department of Agriculture, July 2004.
European Commission EUROSTAT. Internet site: http://epp.eurostat.ec.europa.eu/newxtweb/ (Accessed October 2007).
Fuller S. , Bello H. , and Capps O. 1992 Import Demand for U.S. Fresh Grapefruit: Effect of U.S. Promotion Programs and Trade Policies of Importing Nations. Southern Journal of Agricultural Economics, 251.
Halliburton K. and Henneberry S. R. 1993 US Overseas Promotion Programs for Peanuts: An Examination of Trade and Market Development. Agribusiness 9 6 : 569 – 583 .
Halliburton K. and Henneberry S. R. 1995 The Effectiveness of U.S. Nonprice Promotion of Almonds in the Pacific Rim. Journal of Agricultural and Resource Economics 20 1 : 108 – 121 .
Kinnucan H. W. and Christian J. E. 1997 A Method for Measuring Returns to Nonprice Export Promotion with Application to Almonds. Journal of Agricultural and Resource Economics 22 1 : 120 – 132 .
Le C. T. , Kaiser H. M. , and Tomek W. 1997 Export Promotion and Impact Demand for US Red Meat in Selected Pacific Rim Countries. Agribusiness 14 2 : 95 – 105 .
Lee J. Y. and Brown M. G. 1986 Economic Effectiveness of Brand Advertising Programs for U.S. Orange Juice in the European Market: An Error Component Analysis. Journal of Agricultural Economics 37 3 :
Newey W. and West K. 1987 A simple, positive semi-definite, heteroskedasticity and autocorrelation consistent covariance matrix. Econometrica 55 : 703 – 708 .
Onunkwo I. M. and Epperson J. E. 2000 Export Demand for U.S. Pecans: Impacts of U.S. Export Promotion Programs. Agribusiness 16 2 : 253 – 265 .
Richards T. J. , Van Ispelen P. , and Kagan A. 1997 A Two-Stage Analysis of the Effectiveness of Promotion Programs for U.S. Apples. American Journal of Agricultural Economics 79 : 825 – 837 .
Rosson C. P. , Hamming M. D. , and Jones J. W. 1986 Foreign Market Promotion Programs: An Analysis of Promotion Response for Apples, Poultry, and Tobacco. Agribusiness 2 1 : 33 – 42 .
Solomon H. and Kinnucan H. W. 1993 Effects of Non-Price Export Promotion: Some Evidence for Cotton. Australian Journal of Agricultural Economics 37 1 : 1 – 15 .
SourceOECD: Main Economic Indicators and National Accounts Statistics. Internet cite: http://oberon.sourceoecd.org (Accessed November 2007).
U.S. Department of Agriculture, Foreign Agricultural Services (FAS) Production, Supply and Distribution (PSD online). Internet cite: http://www.fas.usda.gov/psdonline/psdHome.aspx (Accessed October 2007) .
U.S. Department of Agriculture, Foreign Agricultural Services (FAS) U.S. Trade Internet System (FASonline). Internet cite: http://www.fas.usda.gov/ustrade/ (Accessed October 2007).
Notes
Author Affiliations
1 Former Post Doctoral Associate and Professor, respectively, Department of Agricultural and Applied Economics, University of Georgia, Griffin, GA 30223-1797. *Corresponding author email: Tullayaja@yahoo.com
Footnotes
2Equation (4) was estimated by OLS. The Newey-West’s (1989) method was used to estimate heteroskedasticity and autocorrelation consistent standard errors to correct for any unknown form of heteroskedasticity and autocorrelation.
3The Argentina and Chinese supplies of peanuts in the interna- tional marketing grew from 8 and 25 percent in 1991 to 23 and 36 percent in 2006, respectively.
4Export prices of Chinese and Argentinean peanuts obtained from EUROSTAT assume that the relative values between U.S. peanut prices to Argentinean and Chinese prices is the same in the European and the Canadian and Mexican markets. This also assumes that transportation costs are the same for exports from Argentina and China to Europe or North America.
5Kinnucan and Christian proposed an alternative method for measuring returns of export promotion programs which generally results in higher marginal return values. However, their method requires extra information (e.g., domestic supply and domestic demand elasticities for peanuts) which is not readily available. Hence, the calculated marginal returns presented in this study are conservative estimates of the effects of the U.S. export promotion program